1. Main points
In April 2015 median gross weekly earnings for full-time employees were £528, up 1.8% from £518 in 2014. This follows an annual growth of 0.2% between 2013 and 2014. Growth has been slower since the economic downturn, averaging around 1.5% per year between 2009 and 2015
Adjusted for inflation, weekly earnings increased by 1.9% compared to 2014. This is the first increase since 2008, and is due to a combination of growth in average earnings and a low level of inflation
For the year ending 5 April 2015 median gross annual earnings for full-time employees were £27,600, an increase of 1.6% from the previous year
The gender pay gap for median earnings of full-time employees decreased to 9.4%, from 9.6% in 2014. This is the lowest since the survey began in 1997, although the gap has changed relatively little over the last 4 years. A similar trend is seen when full-time and part-time employees are combined, although the gap is unchanged from 2014, at 19.2%
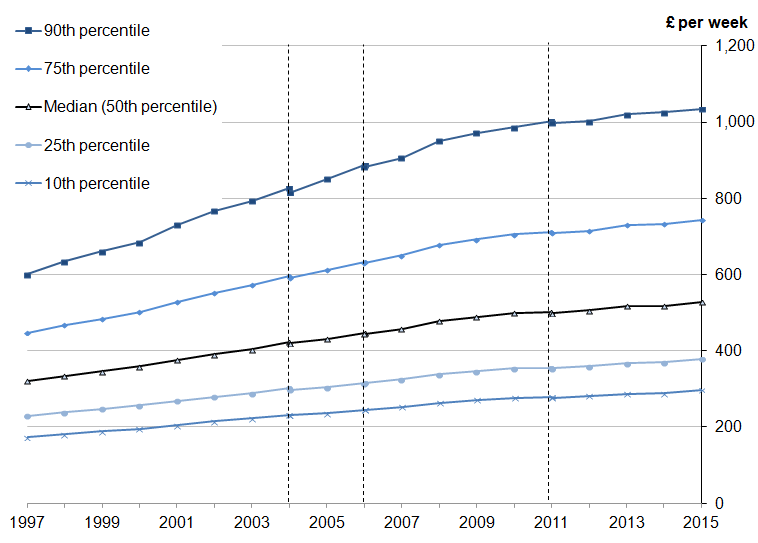
In April 2015 the bottom 10% of full-time employees earned less than £297 per week. At the other end of the distribution, the top 10% of full-time employees earned more than £1,035. Since 1997, earnings at the 90th percentile have remained consistently at around 3.5 times earnings at the 10th percentile
Median gross weekly earnings for full-time employees increased by 1.8% in the public sector, and by 1.6% in the private sector. Private sector earnings have remained consistently at around 85% of public sector earnings since 2009
2. Introduction
This bulletin presents analyses from the Annual Survey of Hours and Earnings (ASHE), which is our most detailed and comprehensive source of earnings information.
Our headline measure of earnings from ASHE is median weekly earnings for full-time employees. This measure is the main focus of this release, but discussion of mean earnings, hourly earnings, annual earnings and earnings for part-time employees is also included for comparison. Figures are presented in terms of gross pay (that is, before tax, National Insurance and other deductions) in current prices, unless otherwise stated.
This bulletin contains provisional estimates from the 2015 survey. The 2014 estimates have been subject to small revisions since the provisional publication on 19 November 2014. The full suite of reference tables from the 2015 ASHE and from all previous years back to 1997 is available on the ONS website.
An explanation of definitions used in this bulletin and further methodological information can be found in the background notes.
We constantly aim to improve our ASHE outputs and associated commentary. Please contact earnings@ons.gov.uk with any feedback or questions.
Back to table of contents3. Average earnings
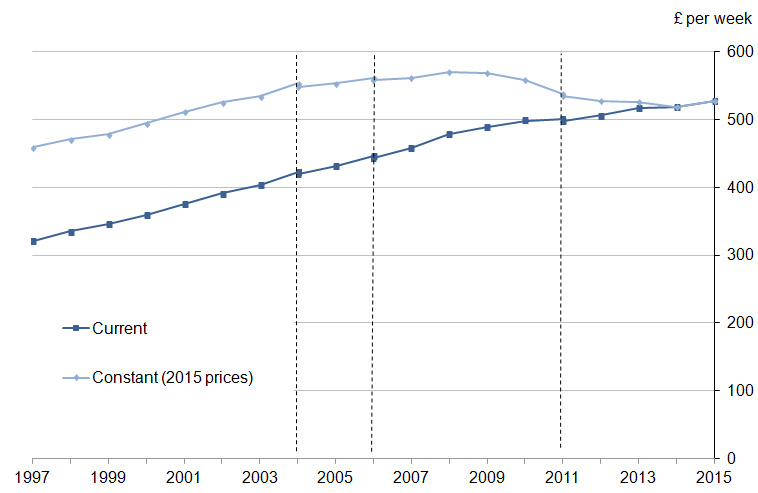
In April 2015, median gross weekly earnings for full-time employees were £528, up 1.8% from £518 in 2014. This followed a particularly slow growth between 2013 and 2014 of 0.2%.
Up until 2008, growth was fairly steady, averaging around 4% each year. However, since the start of the economic downturn growth has been slower, with the annual increase averaging around 1.5% per year between 2009 and 2015.
To understand changes in earnings in the context of inflation, historic data are adjusted using the Consumer Prices Index (CPI). This gives a measure of the ‘real’ value of earnings, with a decrease meaning that earnings growth is below inflation.
Adjusted for inflation, weekly earnings increased by 1.9% compared with 2014. This is the first increase since 2008, and is due to a combination of growth in average earnings and a low level of inflation (the CPI fell by 0.1% in the year to April 2015).
Figure 1: Median full-time gross weekly earnings in current and constant (2015) prices, UK, April 1997 to 2015
Source: Annual Survey of Hours and Earnings (ASHE) - Office for National Statistics
Notes:
- Employees on adult rates, pay unaffected by absence
- Full-time defined as employees working more than 30 paid hours per week (or 25 or more for the teaching professions)
- CPI figures are based on the All Items Consumer Prices Index of inflation for April
- Dashed lines represent discontinuities in 2004, 2006 and 2011 ASHE estimates
- 2015 data are provisional
Download this image Figure 1: Median full-time gross weekly earnings in current and constant (2015) prices, UK, April 1997 to 2015
.png (22.7 kB) .xls (111.1 kB)
The composition of the workforce and therefore the ASHE sample, changes from year to year, which can affect changes in median earnings. For example, creation of lower paid jobs, or loss of highly-paid jobs, both act to reduce the median. Figure 3 illustrates how this can influence earnings statistics.
One approach to removing these compositional effects is to only look at jobs in which the employee has been in the same post for at least 1 year (termed “continuous employment”). This shows consistently higher growth rates over time (as shown in Figure 2), and in April 2015 median earnings for full-time employees in this group grew by 4.3% compared with April 2014.
Around 80% of the full-time workforce remained in the same job between 2014 and 2015. This group can experience pay increases due to factors such as progression through a pay scale, entitlement to a higher minimum wage, and pay settlements.
The change in median earnings for the continuously employed group shows how much a typical continuously employed person in the current year is earning compared with the typical employee from the same group in the previous period. Care should be taken not to interpret this change as necessarily typical of the change in wages experienced by the majority of the continuously employed group. It should also be noted that the change in median earnings does not mean that half of the continuously employed received an increase in weekly earnings of more than 4.3% and half less than 4.3%. There will be a range of changes in earnings between years for continuously employed individuals. An alternative statistic is to calculate the median for the distribution of increases in earnings.
“Understanding Average Earnings for the Continuously Employed”, published earlier this year, gives information on this alternative measure, along with further guidance on how to interpret these statistics.
Figure 2: Annual percentage change in median full-time gross weekly earnings for all employees and those in continuous employment, UK, April 2005 to 2015
Source: Annual Survey of Hours and Earnings (ASHE) - Office for National Statistics
Notes:
- The “continuously employed” group is made up of employees who appear in consecutive ASHE samples, have a weekly earnings observation in both periods and are classified by their employer as being in the same job for at least 12 months in the second period
- Employees on adult rates, pay unaffected by absence
- Full-time defined as employees working more than 30 paid hours per week (or 25 or more for the teaching professions)
- CPI figures are based on the All Items Consumer Prices Index of inflation for April
- 2015 data are provisional
Download this chart Figure 2: Annual percentage change in median full-time gross weekly earnings for all employees and those in continuous employment, UK, April 2005 to 2015
Image .csv .xls
Figure 3: Entry and exit of employees between time periods can affect the median.

Download this image Figure 3: Entry and exit of employees between time periods can affect the median.
.png (80.9 kB)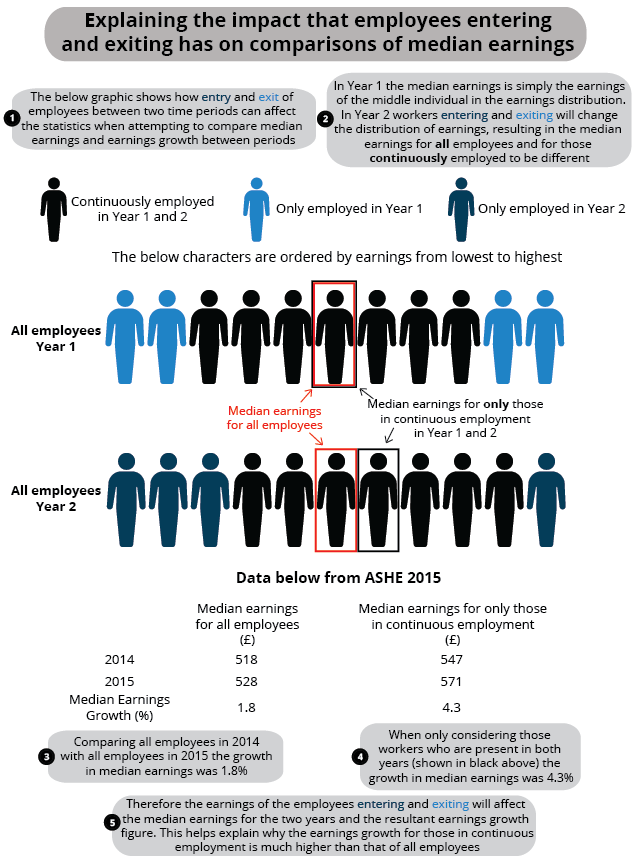
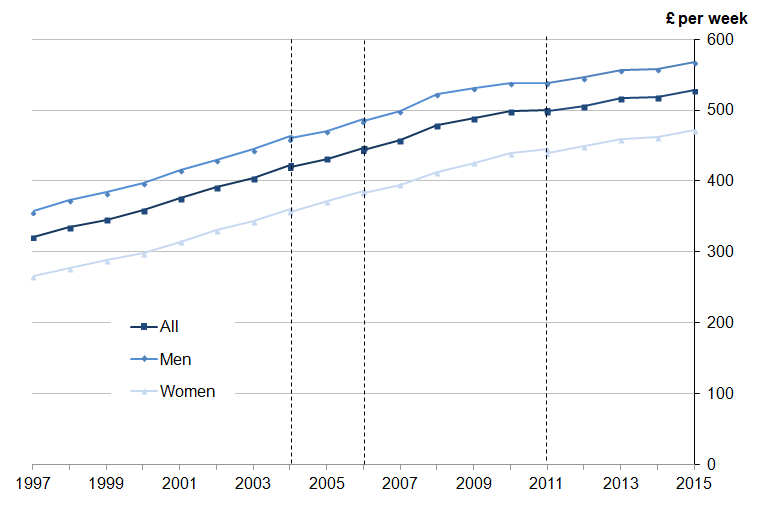
Men working full-time earned more than women (£567 per week in April 2015 compared with £471), with both seeing increases in median earnings compared with 2014 (1.5% and 2.1% respectively). The gap between men’s and women’s earnings has remained relatively consistent from 1997 to 2015 at around £100 (as shown in Figure 4), but this corresponds to a faster rate of increase for women than for men over this period (a 78% increase compared with 59% respectively), meaning that the gap has been closing in percentage terms.
While these results provide a useful measure of earnings trends for men and women, our preferred measure of the “gender pay gap” uses hourly earnings excluding overtime. This is discussed in the gender pay gap section.
Figure 4: Median full-time gross weekly earnings by sex, UK, 1997 to 2015
Source: Annual Survey of Hours and Earnings (ASHE) - Office for National Statistics
Notes:
- Employees on adult rates, pay unaffected by absence
- Full-time defined as employees working more than 30 paid hours per week (or 25 or more for the teaching professions)
- Dashed lines represent discontinuities in 2004, 2006 and 2011 ASHE estimates
- 2015 data are provisional
Download this image Figure 4: Median full-time gross weekly earnings by sex, UK, 1997 to 2015
.png (27.8 kB) .xls (173.6 kB)
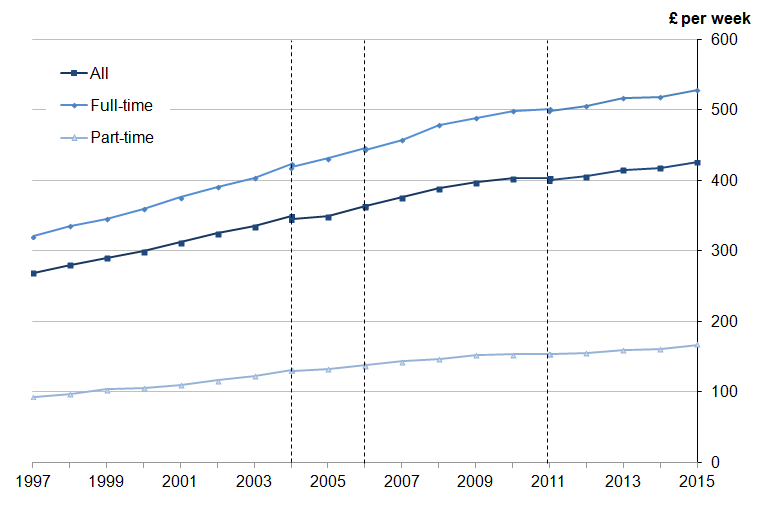
Compared with full-time jobs, stronger growth was seen for part-time jobs, with median earnings for part-time jobs increasing by 3.7%, compared with 1.8% for full-time jobs.
Figure 5: Median gross weekly earnings, UK, April 2015
Source: Annual Survey of Hours and Earnings (ASHE) - Office for National Statistics
Notes:
- Employees on adult rates, pay unaffected by absence
- Full-time defined as employees working more than 30 paid hours per week (or 25 or more for the teaching professions)
- Dashed lines represent discontinuities in 2004, 2006 and 2011 ASHE estimates
- 2015 data are provisional
Download this image Figure 5: Median gross weekly earnings, UK, April 2015
.png (25.2 kB) .xls (89.6 kB)
Annual earnings (with a median of £27,600) for full-time employees showed an increase (of 1.6%) after last year’s slow growth of (0.8%).
Figure 6: Median full-time gross annual earnings by sex, UK, 1999 to 2015

Source: Annual Survey of Hours and Earnings (ASHE) - Office for National Statistics
Notes:
- Employees on adult rates who have been in the job for more than one year
- Full-time defined as employees working more than 30 paid hours per week (or 25 or more for the teaching professions)
- Earnings for tax year ending 5 April
- Dashed lines represent discontinuities in 2004, 2006 and 2011 ASHE estimates
- 2015 data are provisional
Download this image Figure 6: Median full-time gross annual earnings by sex, UK, 1999 to 2015
.png (27.5 kB) .xls (112.1 kB)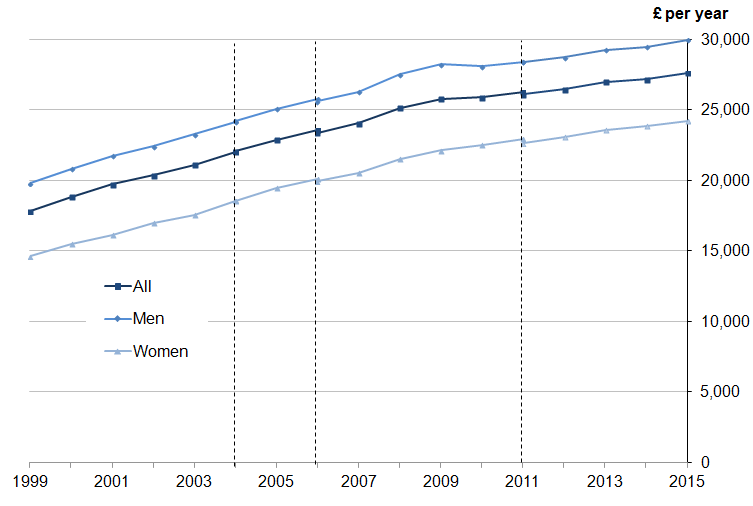
4. Distribution of earnings
Focusing solely on the median hides some interesting trends for low- and high-earning employees. Figure 7 displays the distribution of weekly earnings among full-time employees for the years 1997 to 2015.
For 2015, at the bottom of the distribution, 10% of full-time employees earned less than £297 per week (the 10th percentile), whereas at the other end of the scale 10% earned more than £1,035 per week (the 90th percentile). Each year since 1997 earnings at the 90th percentile have remained consistently at around 3.5 times that of the 10th percentile.
Figure 7: Distribution of full-time gross weekly earnings, UK, April 1997 to 2015
Source: Annual Survey of Hours and Earnings (ASHE) - Office for National Statistics
Notes:
- Employees on adult rates, pay unaffected by absence
- Full-time defined as employees working more than 30 paid hours per week (or 25 or more for the teaching professions)
- Dashed lines represent discontinuities in 2004, 2006 and 2011 ASHE estimates
- 2015 data are provisional
Download this image Figure 7: Distribution of full-time gross weekly earnings, UK, April 1997 to 2015
.png (33.4 kB) .xls (126.5 kB)
5. Gender pay differences
While there is no single measure that adequately deals with the complex issue of the differences between men’s and women’s pay, we prefer to use median hourly earnings (excluding overtime). Including overtime can skew the results because men work relatively more overtime than women, and using hourly earnings better accounts for the fact that men work on average more hours than women. The median is less affected by a relatively small number of very high earners than the mean, and therefore gives a better indication of typical pay.
It should be noted that the figures do not show differences in rates of pay for comparable jobs, as they are affected by factors such as the proportion of men and women in different occupations. For example, a higher proportion of women work in occupations such as administration and caring, that tend to offer lower salaries.
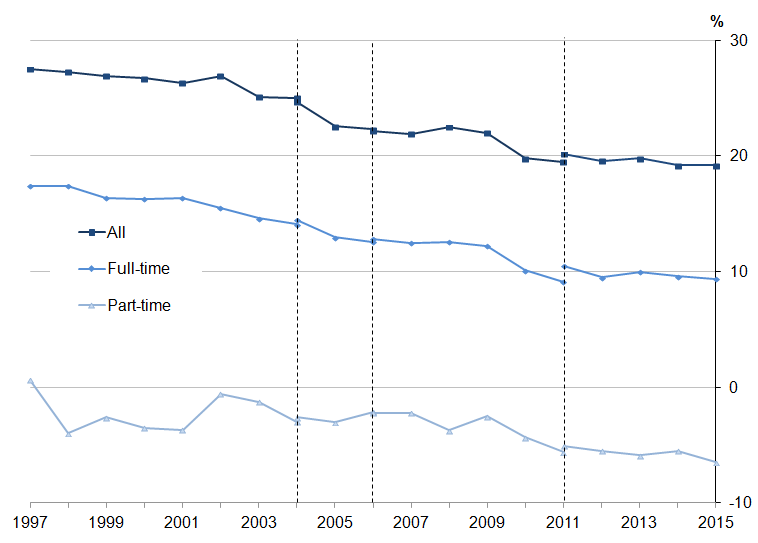
Part-time workers – both men and women – earn less, on average, per hour than their full-time counterparts. A much higher proportion of women work part-time, 41%, compared with men, at 11% (source: Labour Force Survey, Quarter 2 (April to June) 2015). This means that the gap for all employees, full-time and part-time together, is higher than for full-time employees alone.
Given the strong influence of the balance between full-time and part-time employees, the majority of detailed analyses in this section are presented for full-time employees alone. Figures for full-time and part-time employees combined are included in the downloadable spreadsheets accompanying the charts.
In April 2015 the gender pay gap based on median earnings for full-time employees decreased to 9.4% from 9.6% in 2014. This is the lowest since the survey began in 1997, although the gap has changed relatively little in recent years. A similar trend is seen when part-time employees are included, although the gap in 2015 is unchanged from 2014, at 19.2%.
For part-time employees separately, women are paid more on average, resulting in a “negative” gender pay gap. Although the trend is more volatile than for full-time employees, there is evidence that the gap has widened in the long-term. It has remained relatively stable in recent years, although it increased from 5.5% in April 2014 to 6.5% in April 2015.
Comparisons with other EU countries can be found on the Eurostat website (note that the latest figures available are for 2013).
"Analysis of factors affecting earnings using Annual Survey of Hours and Earnings – 2015”, also published today, presents further analysis of gender pay differences, controlling for certain individual and job-related characteristics.
Figure 8: Gender pay gap for median gross hourly earnings (excluding overtime), UK, April 1997 to 2015
Source: Annual Survey of Hours and Earnings (ASHE) - Office for National Statistics
Notes:
- Employees on adult rates, pay unaffected by absence
- Figures represent the difference between men's and women's hourly earnings as a percentage of men's earnings
- Full-time defined as employees working more than 30 paid hours per week (or 25 or more for the teaching professions)
- Dashed lines represent discontinuities in 2004, 2006 and 2011 ASHE estimates
- 2015 data are provisional
Download this image Figure 8: Gender pay gap for median gross hourly earnings (excluding overtime), UK, April 1997 to 2015
.png (26.4 kB) .xls (90.6 kB)
Figure 9 shows gender pay differences by age group. When looking at the differences for full-time employees, the gap is relatively small up to and including those aged 30 to 39 (with the exception of the 16 to 17 age group). In fact, in the 22 to 29 age group, women are paid on average slightly more than men. From 40 upwards, the gap is much wider, with men being paid substantially more on average than women. This is likely to be connected with the fact that women who have children often take time out of the labour market.
Taking full-time and part-time employees together, for all age groups except 16 to 17, men are paid more on average than women. Also, for all age groups from 22 to 29 upwards, the gap is wider than for full-time employees alone. This indicates that, in these age groups, more women are working part-time in jobs that tend to be lower paid.
Figure 9: Gender pay gap for median gross hourly earnings (excluding overtime) by age group, UK, April 2015
Source: Annual Survey of Hours and Earnings (ASHE) - Office for National Statistics
Notes:
- Employees on adult rates, pay unaffected by absence
- Figures represent the difference between men's and women's hourly earnings as a percentage of men's earnings
- Full-time defined as employees working more than 30 paid hours per week (or 25 or more for the teaching professions)
- 2015 data are provisional
Download this chart Figure 9: Gender pay gap for median gross hourly earnings (excluding overtime) by age group, UK, April 2015
Image .csv .xlsFigure 10 examines the gender pay gap for high and low earners from 1997 to 2015. At the top decile (the top 10% of earners), the gap for full-time employees has remained largely consistent, fluctuating around 20%. For lower earners (the bottom 10% of earners) the gap has narrowed over the long term, to 6.5% in April 2015, although it has changed little in recent years.
Figure 10: Gender pay gap for median gross hourly earnings (excluding overtime) for full-time employees at selected deciles, UK, April 1997 to 2015

Source: Annual Survey of Hours and Earnings (ASHE) - Office for National Statistics
Notes:
- Employees on adult rates, pay unaffected by absence
- Figures represent the difference between men's and women's hourly earnings as a percentage of men's earnings
- Full-time defined as employees working more than 30 paid hours per week (or 25 or more for the teaching professions)
- Dashed lines represent discontinuities in 2004, 2006 and 2011 ASHE estimates
- 2015 data are provisional
Download this image Figure 10: Gender pay gap for median gross hourly earnings (excluding overtime) for full-time employees at selected deciles, UK, April 1997 to 2015
.png (26.0 kB) .xls (149.5 kB)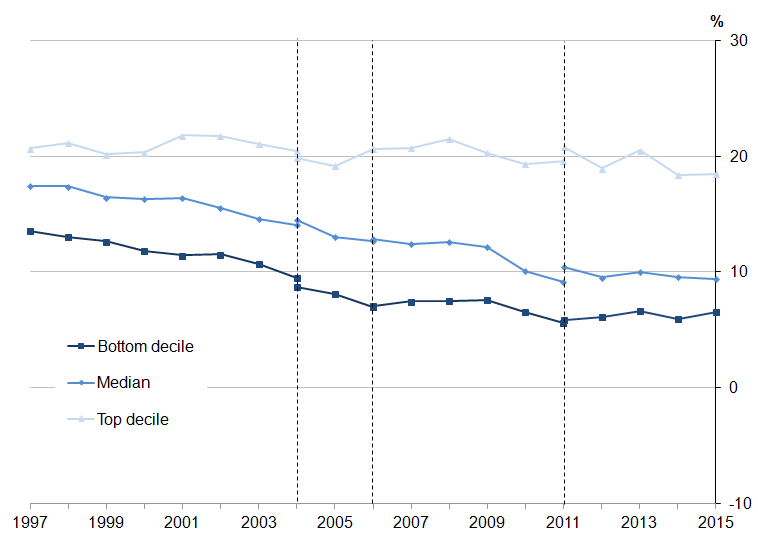
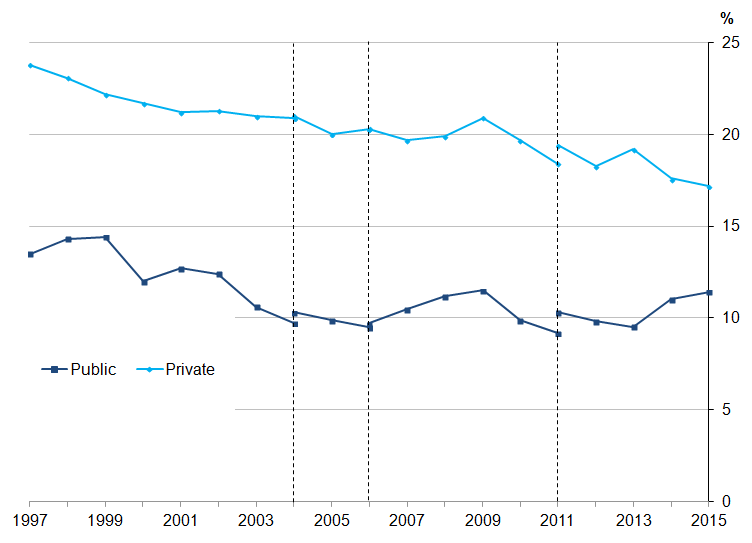
The gender pay gap for full-time employees in the private sector decreased from 17.6% in 2014 to 17.2% in 2015, the lowest since the series began in 1997 and continuing the long-term downward trend. The gender pay gap in the public sector increased for the second consecutive year from 11.0% to 11.4%, although it is of note that this has been relatively stable over the longer term, fluctuating around 10% since 2003.
Note that the composition of the public and private sectors changes from year to year, and this will influence the figures presented. For example, in a given sector, creation of jobs in higher paying occupations with a high proportion of female employees would act to reduce the gap.
Figure 11: Gender pay gap for median full-time hourly earnings (excluding overtime) for public and private sectors, UK, April 1997 to 2015
Source: Annual Survey of Hours and Earnings (ASHE) - Office for National Statistics
Notes:
- Employees on adult rates, pay unaffected by absence
- Gender pay gap is defined as the difference between men’s and women’s hourly earnings as a percentage of men’s earnings
- Full-time defined as employees working more than 30 paid hours per week (or 25 or more for the teaching professions)
- Dashed lines represent discontinuities in 2004, 2006 and 2011 ASHE estimates
- 2015 data are provisional
Download this image Figure 11: Gender pay gap for median full-time hourly earnings (excluding overtime) for public and private sectors, UK, April 1997 to 2015
.png (23.9 kB) .xls (134.1 kB)
The gender pay gap also varies by occupation. For full-time employees the gap is "positive" for all the main occupation groups, ranging from 4.3% for sales and customer service, to 24.6% for skilled trades occupations in April 2015.
Figure 12: Gender pay gap for median full-time hourly earnings (excluding overtime), by major occupation group, UK, April 2015
Source: Annual Survey of Hours and Earnings (ASHE) - Office for National Statistics
Notes:
- Employees on adult rates, pay unaffected by absence
- Gender pay gap is defined as the difference between men’s and women’s hourly earnings as a percentage of men’s earnings
- Full-time defined as employees working more than 30 paid hours per week (or 25 or more for the teaching professions)
- Occupations as defined by the Standard Occupational Classification 2010
- 2015 data are provisional
Download this chart Figure 12: Gender pay gap for median full-time hourly earnings (excluding overtime), by major occupation group, UK, April 2015
Image .csv .xls6. Public and private sector pay
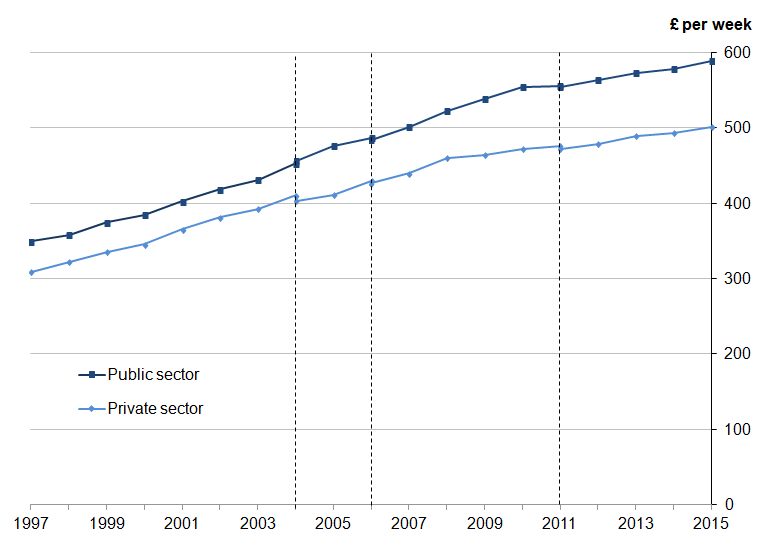
Median weekly earnings for full-time employees in the public sector have been higher than for the private sector since the start of the series in 1997. Private sector earnings were £501 in April 2015, compared with £589 for the public sector. Private sector earnings have remained consistently at around 85% of public sector earnings since 2009.
The public and private sectors have workforces which are composed quite differently. Consequently, differences in weekly earnings do not reveal differences in rates of pay for comparable jobs. For example, many of the lowest paid occupations, such as bar and restaurant staff, hairdressers, elementary sales occupations and cashiers, exist primarily in the private sector, while there are a larger proportion of graduate-level and professional occupations in the public sector.
“Analysis of factors affecting earnings using Annual Survey of Hours and Earnings – 2015” (also published today), presents further analysis of earnings differences between the public and private sectors, controlling for certain individual and job-related characteristics.
Figure 13: Median full-time gross weekly earnings for public and private sectors, UK, April 1997 to 2015
Source: Annual Survey of Hours and Earnings (ASHE) - Office for National Statistics
Notes:
- Employees on adult rates, pay unaffected by absence
- Full-time defined as employees working more than 30 paid hours per week (or 25 or more for the teaching professions)
- Dashed lines represent discontinuities in 2004, 2006 and 2011 ASHE estimates
- 2015 data are provisional
Download this image Figure 13: Median full-time gross weekly earnings for public and private sectors, UK, April 1997 to 2015
.png (25.5 kB) .xls (89.6 kB)
7. Regional earnings
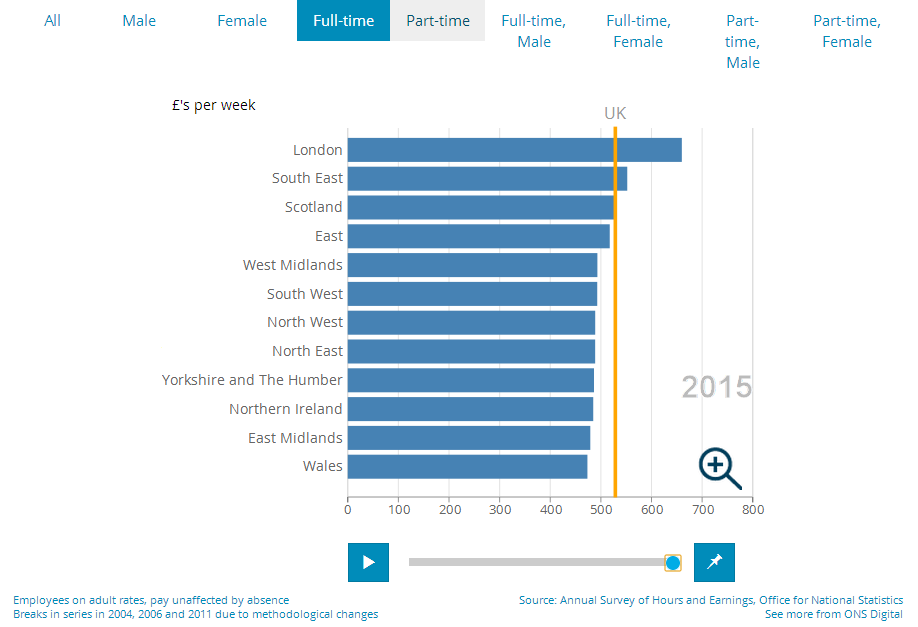
In April 2015, London topped the regional list for median earnings for full-time employees, at £660 per week. Employees here earned £108 more per week than the next highest, the South East (£552), and £132 more than the median for the whole of the UK (£528). The high pay in London is largely due to a high proportion of its labour force being employed in high-paying industries and occupations, and also because many employees are entitled to allowances for working in the capital.
The regional pattern has remained fairly consistent since the series began in 1997, with London and the South East consistently topping the list.
At the local authority level, earnings vary significantly. In April 2015 full-time employees working in the City of London had the highest median gross weekly earnings (£921) and those working in North East Derbyshire had the lowest (£389). To explore these geographic differences further an interactive map showing earnings by local authority and an animated chart showing changes in weekly earnings by region over time are available. Figures 14 and 15 below show screenshots of these interactives.
It should be noted that earnings comparisons take no account of regional variations in prices for goods and services and therefore do not necessarily indicate differences in the standard of living. Neither do they take account of differences in the regional composition of the workforce, meaning that like-for-like comparisons may not be appropriate. For example, a region might have a lower level of median earnings than another if it has a higher proportion of employees in industries or occupations with relatively low earnings.
Figure 14: What are the average earnings where you work?

Download this image Figure 14: What are the average earnings where you work?
.png (231.1 kB)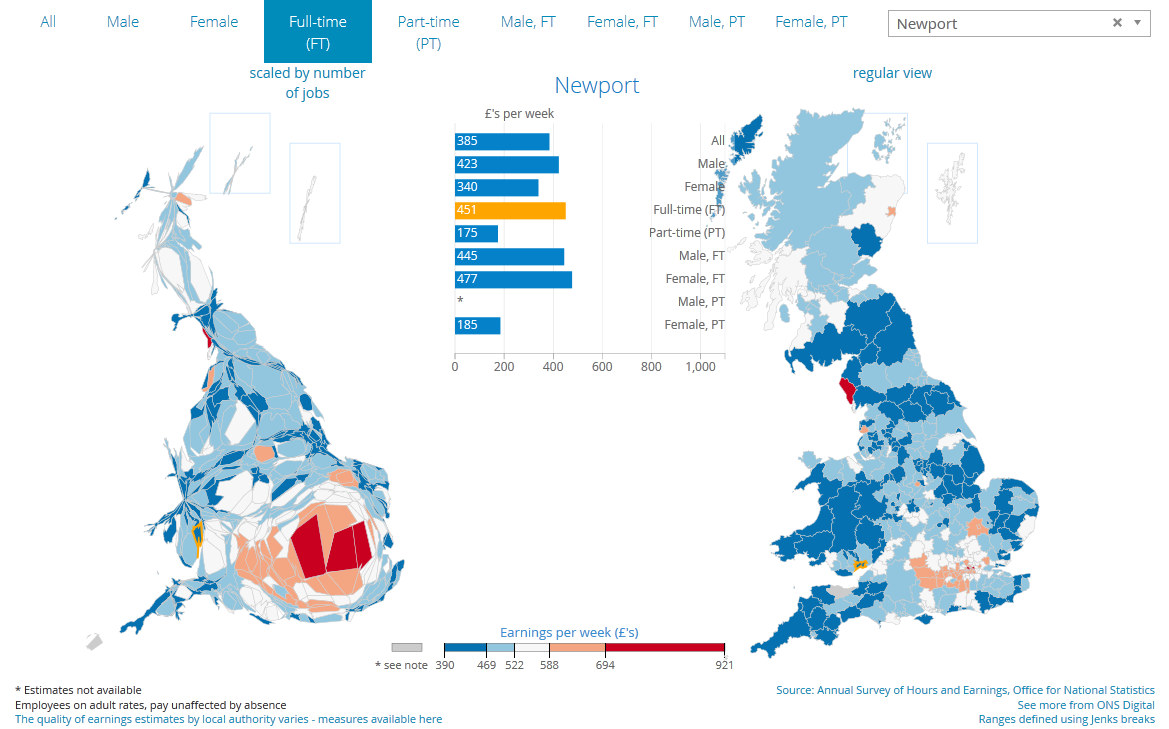
Figure 15: The screenshot of an interactive bar chart shows how regional earnings move through time.
Download this image Figure 15: The screenshot of an interactive bar chart shows how regional earnings move through time.
.png (30.8 kB)
Figure 16: Median full-time gross weekly earnings and percentage change from previous year, by region, UK, April 2015
Source: Annual Survey of Hours and Earnings (ASHE) - Office for National Statistics
Notes:
- Employees on adult rates, pay unaffected by absence
- Full-time defined as employees working more than 30 paid hours per week (or 25 or more for the teaching professions)
- 2015 data are provisional
Download this chart Figure 16: Median full-time gross weekly earnings and percentage change from previous year, by region, UK, April 2015
Image .csv .xls8. Earnings by age group
Median weekly earnings for full-time employees reach a maximum in the 40 to 49 age group for men (£653) and in the 30 to 39 age group for women (£538).
Figure 17: Median full-time gross weekly earnings by sex and age group, UK, April 2015
Source: Annual Survey of Hours and Earnings (ASHE) - Office for National Statistics
Notes:
- All employees aged 16 to 17 and employees aged 18 and over on adult rates, pay unaffected by absence
- Full-time defined as employees working more than 30 paid hours per week (or 25 or more for the teaching professions)
- 2015 data are provisional
Download this chart Figure 17: Median full-time gross weekly earnings by sex and age group, UK, April 2015
Image .csv .xls9. Earnings by occupation
The major occupation group with the highest median weekly earnings for full-time employees was managers, directors and senior officials, at £784. Caring, leisure and other service occupations were the lowest paid group, at £341 per week.
More detailed information for specific occupations can be found in the tables accompanying this release.
Figure 18: Median full-time gross weekly earnings and percentage change from previous year, by major occupation group, UK, April 2015

Source: Annual Survey of Hours and Earnings (ASHE) - Office for National Statistics
Notes:
- Employees on adult rates, pay unaffected by absence
- Full-time defined as employees working more than 30 paid hours per week (or 25 or more for the teaching professions)
- Occupations as defined by the Standard Occupational Classification 2010
- 2015 data are provisional
Download this image Figure 18: Median full-time gross weekly earnings and percentage change from previous year, by major occupation group, UK, April 2015
.png (25.7 kB) .xls (48.1 kB)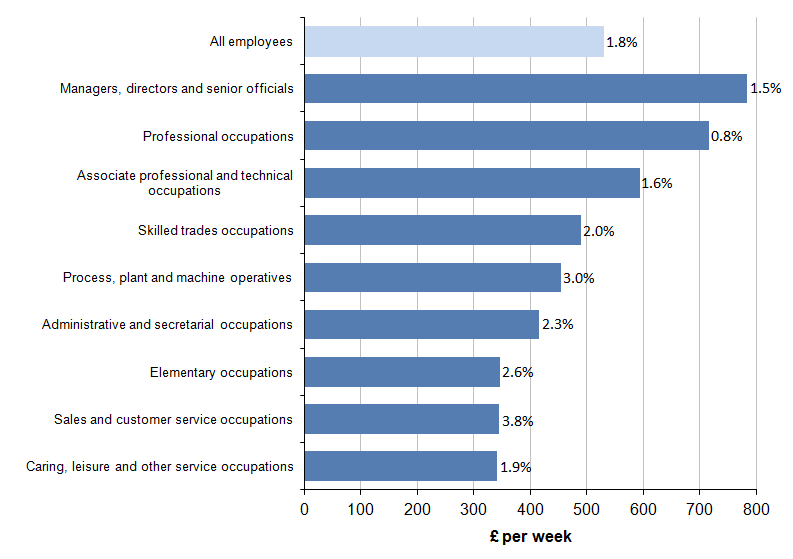
10. The make-up of earnings
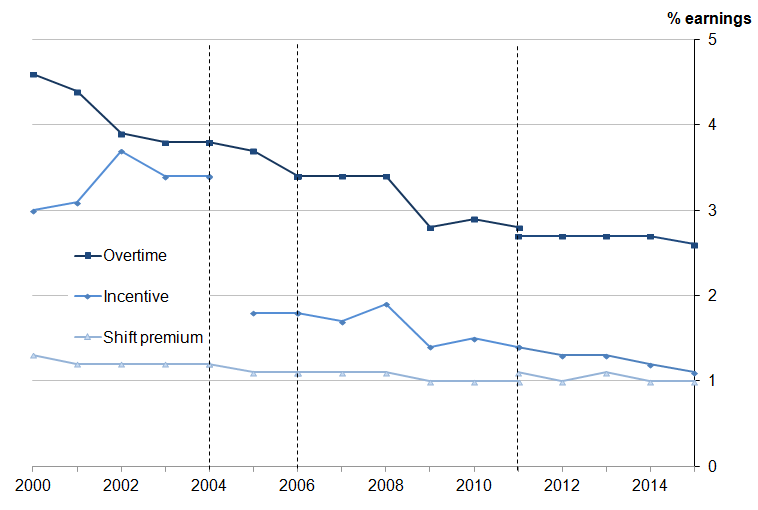
Overtime payments as a proportion of mean gross weekly earnings for full-time employees have remained relatively stable in recent years, following a sharp fall coinciding with the economic downturn. The proportion accounted for by incentive payments has decreased steadily since 2010, to 1.1% in 2015.
As is the case in previous years, overtime and incentive payments account for a greater proportion of mean gross weekly pay for men than they do for women.
Figure 19: Non-basic components of pay as a proportion of mean full-time gross weekly earnings, UK, April 2000 to 2015
Source: Annual Survey of Hours and Earnings (ASHE) - Office for National Statistics
Notes:
- Employees on adult rates, pay unaffected by absence
- Calculation of mean includes zero responses
- Full-time defined as employees working more than 30 paid hours per week (or 25 or more for the teaching professions)
- Dashed lines represent discontinuities in 2004, 2006 and 2011 ASHE estimates
- A methodological change in 2005 means that estimates for incentive payments from this time onwards are not comparable with earlier estimates
- 2015 data are provisional
Download this image Figure 19: Non-basic components of pay as a proportion of mean full-time gross weekly earnings, UK, April 2000 to 2015
.png (23.8 kB) .xls (81.4 kB)
11. Hours paid
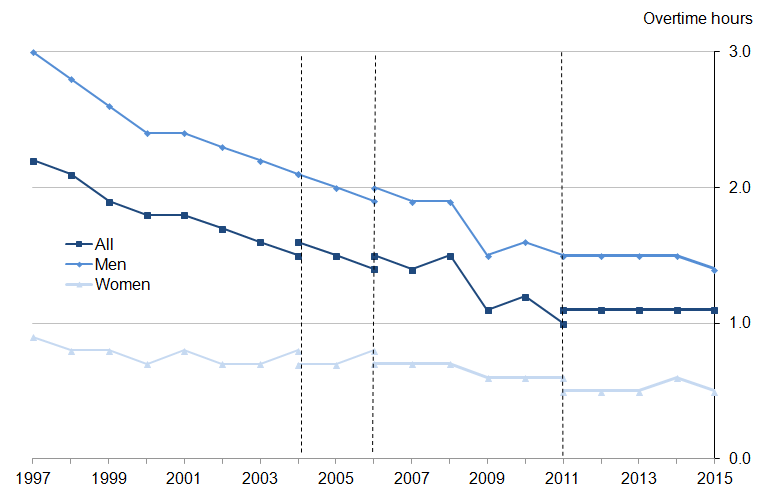
Over the long term, the mean average number of hours paid per week for full-time employees has decreased from 40.0 in 1997 to 39.1 in 2015. This decrease is particularly notable for men, while women’s hours have remained stable at around 37.5. For men, there was a sharp dip between 2008 and 2009, from 40.7 to 40.1, and hours paid have since remained largely stable, not returning to the levels seen prior to the economic downturn. Examining the components of hours paid, there is a long-term decrease in overtime, particularly for men, although this has levelled off in recent years.
Figure 20: Mean full-time weekly paid hours of work (including overtime), UK, April 1997 to 2015

Source: Annual Survey of Hours and Earnings (ASHE) - Office for National Statistics
Notes:
- Employees on adult rates, pay unaffected by absence
- Full-time defined as employees working more than 30 paid hours per week (or 25 or more for the teaching professions)
- Dashed lines represent discontinuities in 2004, 2006 and 2011 ASHE estimates
- 2015 data are provisional
Download this image Figure 20: Mean full-time weekly paid hours of work (including overtime), UK, April 1997 to 2015
.png (24.4 kB) .xls (197.1 kB)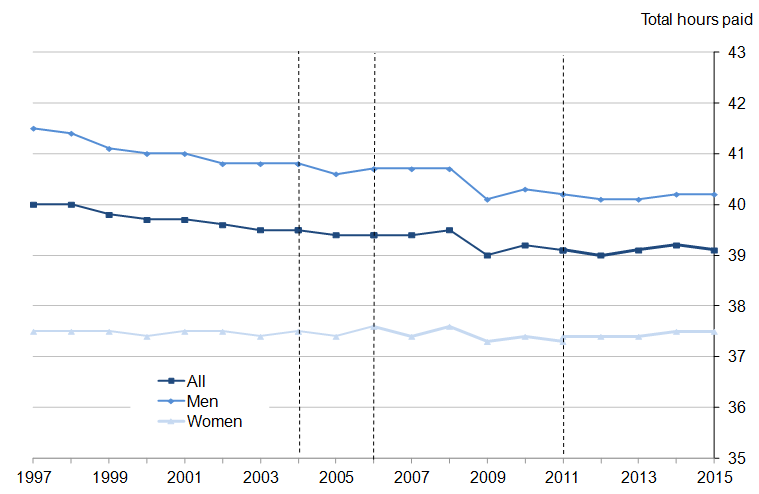
Figure 21: Mean weekly overtime hours, UK, April 1997 to 2015
Source: Annual Survey of Hours and Earnings (ASHE) - Office for National Statistics
Notes:
- Employees on adult rates, pay unaffected by absence
- Calculation of mean includes zero responses
- Full-time defined as employees working more than 30 paid hours per week (or 25 or more for the teaching professions)
- Dashed lines represent discontinuities in 2004, 2006 and 2011 ASHE estimates
- 2015 data are provisional