Table of contents
1. Main points
These estimates are short-term indicators of investment in assets, such as dwellings, transport equipment, machinery, buildings and intangible assets. This release covers asset breakdowns of total gross fixed capital formation (GFCF), of which business investment is one component
All investment data referred to are estimates of seasonally adjusted chained volume measures. No periods are being revised in this release
In Quarter 2 (Apr to June) 2015, GFCF was estimated to have increased by £0.7 billion (0.9%), compared with the previous quarter, to £76.8 billion. This is the highest level that has been recorded for this series, which began in Quarter 1 (Jan to Mar) 1997
In Quarter 2 (Apr to June) 2015, business investment was estimated to have increased by £1.4 billion (2.9%), compared with the previous quarter, to £47.8 billion
In Quarter 2 (Apr to June) 2015, GFCF was estimated to have increased by 4.9% compared with Quarter 2 (Apr to June) 2014
In Quarter 2 (Apr to June) 2015, business investment increased by 5.0% compared with Quarter 2 (Apr to June) 2014
Changes were made to the Quarterly Survey of Capital Expenditure in Quarter 1 (Jan to Mar) 2015. Adjustments have been included for Quarter 2 (Apr to June) 2015 to maintain consistency with the previous survey
2. About this release
The estimates in this release are short-term indicators of investment in non-financial assets in the UK, such as dwellings, transport equipment, machinery, buildings and intellectual property products. This release covers not only business investment, but asset and sector breakdowns of total gross fixed capital formation (GFCF), of which business investment is one component.
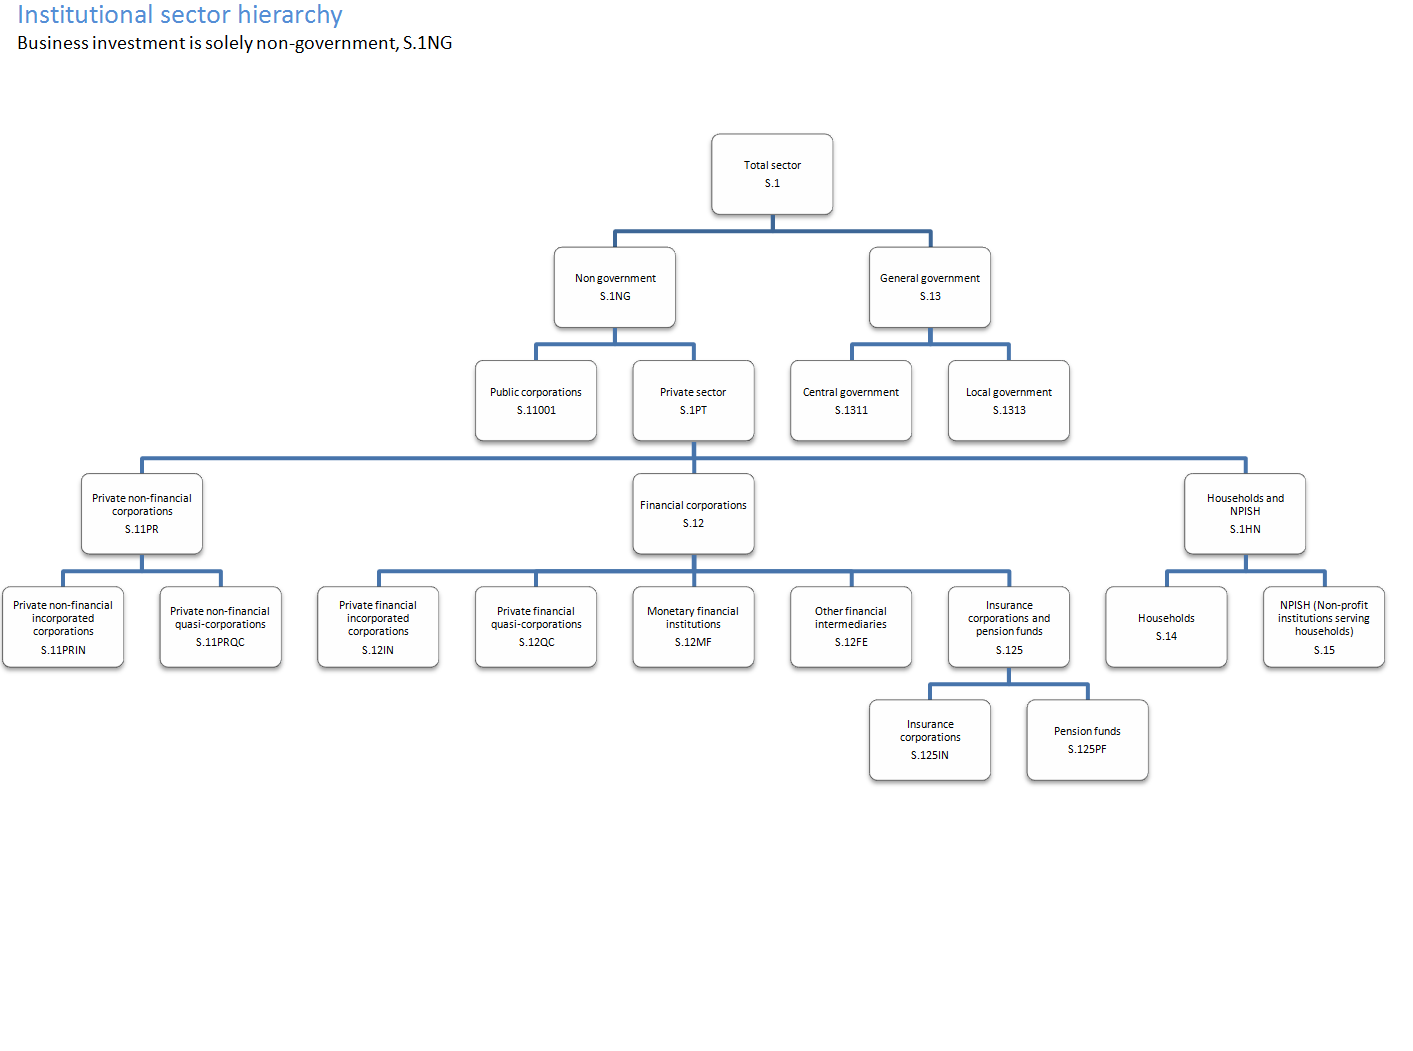
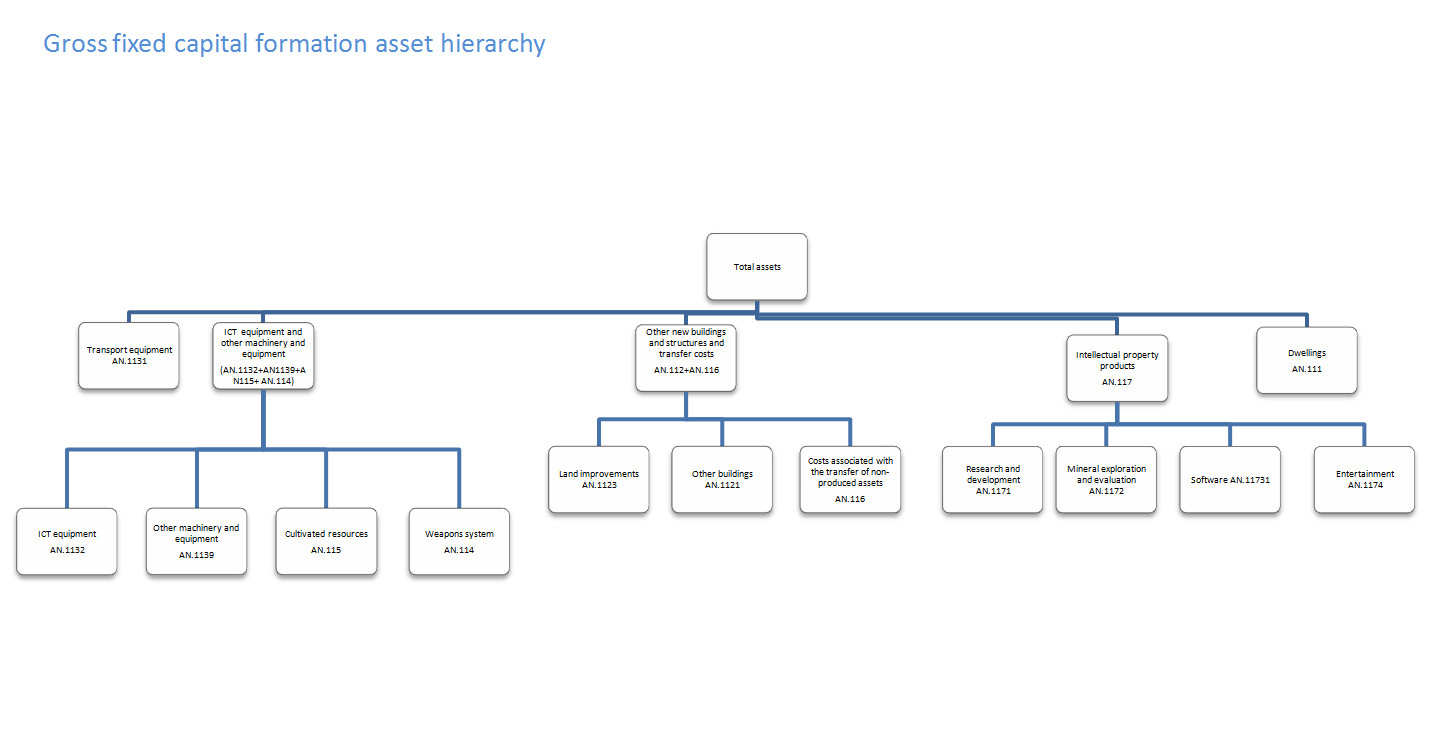
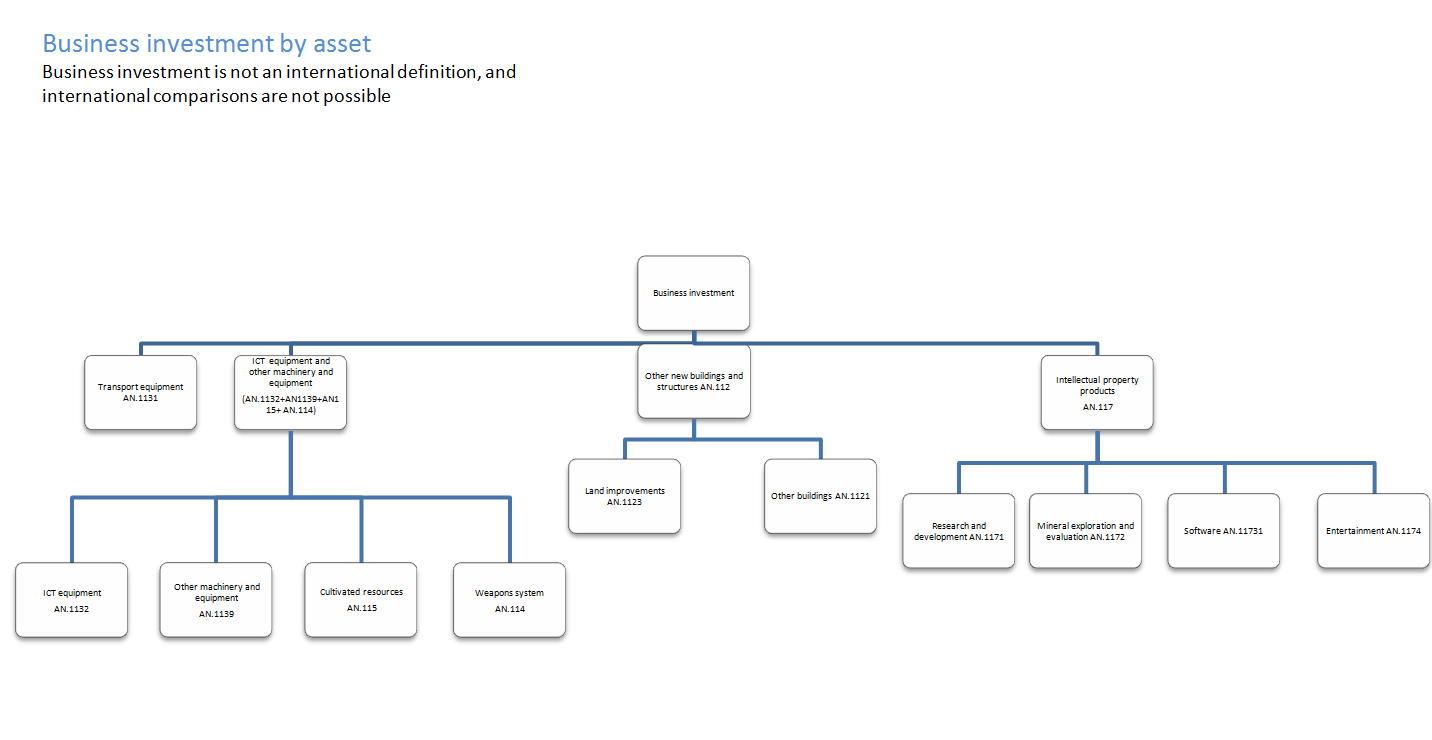
Business investment is net investment by private and public corporations, these include investments in:
transport
information, technology and communications (ICT) equipment
other machinery and equipment
cultivated assets
intellectual property products (IPP, which includes investment in software, research and development, artistic originals and mineral exploration)
buildings and other structures
It does not include investment by central or local government, investment in dwellings or the costs associated with the transfer of non-produced assets (such as land). A full sector and asset hierarchy can be found in the background notes. Note that business investment is not an internationally recognised concept and therefore it should not be used to make international comparisons.
All investment data referred to in this bulletin are estimates of seasonally adjusted chained volume measures.
Back to table of contents3. Changes to the Quarterly Survey of Capital Expenditure and methodological information
Changes to the Quarterly Survey of Capital Expenditure in Quarter 1 (Jan to Mar) 2015
As described in the Business Investment, Quarter 4 (Oct to Dec) 2014 Revised Results bulletin and the article Changes to the Annual Business Survey, the Quarterly Survey of Capital Expenditure and the Survey into Business Spending on Capital Items, in 2015 (114.3 Kb Pdf), we moved to the Quarterly Acquisitions and Disposals of Capital Assets Survey (QCAS) from the Quarterly Survey of Capital Expenditure (CAPEX). The main reason is to move to the updated European System of Accounts (ESA) 2010 manual, the international guidance for national accounts.
The main changes to the survey are:
adding new questions to improve the quality of our estimates and to meet the latest European legislation requirements (ESA 2010)
removing the lower limit of £500 for the value of reported assets, so all relevant assets (even those below businesses’ Asset Register threshold) can be reported
including small tools used in production in the definition of GFCF
improving the questionnaire’s layout, including new sections and headings, to make completing the questionnaire easier
The data from the new questions will not be included in estimates of GFCF and its components until 2017, when there will be two years of data available for quality assurance.
Further methodological information including changes to the UK National Accounts
Estimates in this release have been compiled under ESA 2010 concepts and definitions, in compliance with the UK’s legal obligations in producing the National Accounts. Articles are available describing the methodology used to estimate GFCF and the impact of the changes implemented for ESA10 in September 2014.
Several articles explaining the changes that will be implemented in the UK National Accounts (Blue Book) 2015, to be published in October 2015, were published on 19 May 2015. These articles describe changes related to ongoing work to meet ESA 1995 requirements. These include changes which impact GFCF and its components, specifically spending on repairs and maintenance of dwellings and exhaustiveness. There is a comprehensive list of all published articles relating to changes to the UK National Accounts (Blue Book) This list will be updated when new articles are published.
Back to table of contents4. Gross fixed capital formation and business investment
Figure 1: Annual gross fixed capital formation chained volume measures
Reference year: 2011, Coverage: UK
Source: Quarterly Acquisitions and Disposals of Capital Assets Survey - Office for National Statistics
Download this chart Figure 1: Annual gross fixed capital formation chained volume measures
Image .csv .xls
Figure 2: Quarterly gross fixed capital formation chained volume measures, seasonally adjusted
Reference year: 2011 Coverage: UK
Source: Quarterly Acquisitions and Disposals of Capital Assets Survey - Office for National Statistics
Notes:
- Q1 = Quarter 1 (January to March), Q2 = Quarter 2 (April to June), Q3 = Quarter 3 (July to September), Q4 = Quarter 4 (October to December)
Download this chart Figure 2: Quarterly gross fixed capital formation chained volume measures, seasonally adjusted
Image .csv .xls
Figure 3: Annual business investment chained volume measures
Reference year: 2011, Coverage: UK
Source: Quarterly Acquisitions and Disposals of Capital Assets Survey - Office for National Statistics
Download this chart Figure 3: Annual business investment chained volume measures
Image .csv .xls
Figure 4: Quarterly business investment chained volume measures, seasonally adjusted
Reference year: 2011 Coverage: UK
Source: Quarterly Acquisitions and Disposals of Capital Assets Survey - Office for National Statistics
Notes:
- Q1 = Quarter 1 (January to March), Q2 = Quarter 2 (April to June), Q3 = Quarter 3 (July to September), Q4 = Quarter 4 (October to December
Download this chart Figure 4: Quarterly business investment chained volume measures, seasonally adjusted
Image .csv .xlsFigure 4 shows a large spike in business investment in Quarter 2 (Apr to June) 2005. This is due to the transfer of British Nuclear Fuels Ltd (BNFL). In April 2005, nuclear reactors were transferred from BNFL to the Nuclear Decommissioning Authority (NDA). BNFL is classified as a public corporation in National Accounts, while the NDA is a central government body. The business investment series includes investment by public corporations, but not government spending, the positive spike reflects the £15.6 billion transfer. More information on the transfer of BNFL can be found in section 3 of the background notes.
Summary tables
In Quarter 2 (Apr to June) 2015 total gross fixed capital formation increased by an estimated £0.7 billion (0.9%) compared with the previous quarter. Business investment also saw an increase of 2.9%, rising by an estimated £1.4 billion. These increases were partially offset by a decrease in private sector dwellings of an estimated £0.6 billion (3.9%).
Table 1a: Total gross fixed capital formation in the UK by institutional sector, Quarter 2 2015
| % change | £ million | |||
| Most recent quarter on previous quarter | Most recent quarter on a year earlier | Most recent level ** | Level change from previous quarter | |
| Gross fixed capital formation | 0.9 | 4.9 | 76,799 | 700 |
| Business investment | 2.9 | 5.0 | 47,830 | 1,360 |
| General government | 0.2 | 13.1 | 10,011 | 20 |
| Public corporations dwellings | -3.3 | 4.5 | 858 | -29 |
| Public corporations cost of ownership transfer on non-produced assets | -6.4 | -12.0 | -103 | 7 |
| Private sector dwellings | -3.9 | 1.9 | 14,672 | -603 |
| Private sector cost of ownership transfer on non-produced assets | -1.5 | -5.4 | 3,531 | -55 |
| Source: Office for National Statistics | ||||
| Notes: | ||||
| 1. ** Series may not sum to totals due to rounding | ||||
Download this table Table 1a: Total gross fixed capital formation in the UK by institutional sector, Quarter 2 2015
.xls (26.6 kB)Table 1b: Total gross fixed capital formation in the UK by asset, Quarter 2 2015
| % change | £ million | |||
| Most recent quarter on previous quarter | Most recent quarter on a year earlier | Most recent level ** | Level change from previous quarter | |
| Gross fixed capital formation | 0.9 | 4.9 | 76,799 | 700 |
| Transport equipment | 12.4 | 30.3 | 4,076 | 451 |
| ICT equipment and other machinery and equipment | 7.0 | 6.0 | 17,832 | 1,165 |
| Dwellings | -3.9 | 2.1 | 15,523 | -638 |
| Other buildings and structures and transfer costs | -4.1 | 0.9 | 22,025 | -948 |
| Intellectual property products | 4.0 | 6.7 | 17,343 | 670 |
| Source: Office for National Statistics | ||||
| Notes: | ||||
| 1. ** Series may not sum to totals due to rounding | ||||
Download this table Table 1b: Total gross fixed capital formation in the UK by asset, Quarter 2 2015
.xls (26.6 kB)5. Economic background
Business investment grew by 2.9% in Quarter 2 (Apr to June) 2015 compared with the previous quarter, up from 2.0% growth for the previous quarter. Business investment grew 5.0% in Quarter 2 (Apr to June) 2015 compared with the corresponding quarter of the previous year. Total GFCF growth was more subdued at 0.9% compared with the previous quarter, down from 2.0% for the previous quarter. The weaker growth in GFCF compared with business investment is because of a fall in investment in dwellings (-3.9%) and the weak growth of general government investment (0.2%).
By asset class, the main contributors to the growth of GFCF were, ICT equipment and other machinery and equipment, and intellectual property products, growing by 7.0% and 4.0% respectively. Transport equipment grew very strongly (12.4%), but as a small component of overall GFCF, it had limited impact on the overall growth.
Despite the slightly weaker growth in overall GFCF, business investment continued to grow. This is in line with expectations indicated from external survey data and the Bank of England Monetary Policy Committee meeting on 5 August. As reported in The Bank of England’s inflation report for August, corporate credit conditions continue to support business investment. Although there was little change since Quarter 1 (Jan to Mar) 2015 they have improved considerably since 2013. The report also suggests that the growth in business investment figures may be due to increased demand, resulting in corporations building up their capital stocks, to increase their capacity to produce.
Back to table of contents6. Where to find more of our data
We also publishe additional analyses of GFCF, business investment, and the Quarterly Acquisitions and Disposals of Capital Assets Survey, which have been created in response to ad hoc user requests. These are available to download free from our website. Enquiries about ad hoc requests may be made to gcf@ons.gov.uk
Back to table of contents7. Adjustments, revisions and response rates
Adjustments
As a result of the changes to the survey, response has been lower than expected at 70.8%, when compared with an average of 74.9% in previous provisional second quarters.
Large capital expenditure tends to be reported later in the data collection period than smaller expenditure. This means that larger expenditures are often included in the revised (month 3) results, but are not reported in time for the provisional (month 2) results, leading to a tendency towards upwards revisions in the later estimates for business investment and GFCF. Following investigation of the impact of this effect, from Quarter 3 (July to Sep) 2013, a bias adjustment was introduced to GFCF and its components in the provisional estimate.
A bias adjustment of £1.0 billion for Quarter 2 (April to June) 2015 has been included in this release. This adjustment will be reassessed in the revised results when the survey response rates improve. Users should note that the bias adjustment is a best estimate of the QCAS and the estimate may still be revised either up or down. Therefore, GFCF and business investment will be subject to revision in the Quarter 2 (April to June) 2015 revised (month 3) release. The bias adjustment is intended to reduce the average size of revisions over time. It is not possible to ascertain the direction of any such revisions.
The Quarterly Survey of Capital Expenditure was improved by adding clearer instructions. As detailed in the provisional Quarter 1 (Jan to Mar) 2015 Business Investment release, feedback from some respondents indicated that they had been misreporting their asset breakdown and were correcting this on the new questionnaire. We found that some respondents were reporting new construction work (NCW) as other capital equipment (OCE). From Quarter 1 (Jan to Mar) 2015 respondents to the survey are now reporting more in new construction work at the expense of other capital equipment. In order to remain consistent with the previous data, we have made some adjustments to the assets in the current price series in Quarter 2 (Apr to June) 2015, quality adjustments on asset buildings (-£2.0bn) and other machinery (+£2.0bn). These adjustments will be reviewed as the survey response increases.
Forecast data
In this release, estimates of investment in research and development and artistic originals have been forecast.
Survey response rates
Table 2 presents the provisional (month 2) response rates for the Quarterly Acquisitions and Disposals of Capital Assets Survey (QCAS). The estimates in this release are based on the Quarter 2 (Apr to June) 2015 month 2 (provisional) survey results.
Table 2: UK response rates for quarterly acquisitions and disposals of capital assets survey, 2014 to 2015
| At month 2 (Provisional) | At month 3 (Revised) | ||||
| Period | Survey response rates / % | Period | Survey response rates / % | ||
| 2014 | Q2 | 79.5 | 2014 | Q2 | 91.3 |
| Q3 | 78.7 | Q3 | 91.7 | ||
| Q4 | 80.1 | Q4 | 94.4 | ||
| 2015 | Q1 | 67.3 | 2015 | Q1 | 83.3 |
| Q2 | 70.8 | ||||
| Source: Office for National Statistics | |||||
| Notes: | |||||
| 1. Q1 is Quarter 1 (Jan to Mar) | |||||
| 2. Q2 is Quarter 2 (Apr to June) | |||||
| 3. Q3 is Quarter 3 (July to Sep) | |||||
| 4. Q4 is Quarter 4 (Oct to Dec) | |||||

