Table of contents
- Main points
- Summary
- Introduction
- Survival index for all cancers combined
- Survival index for three cancers combined
- Smoothed maps
- Funnel plots
- Results
- List of Figures - Smoothed maps
- List of Figures - Funnel plots
- Notes on methodology
- Users and uses
- Policy context
- Authors
- Acknowledgements
- Additional information
- References
- Background notes
1. Main points
The one-year cancer survival index for England increased steadily from 59.7% for adults diagnosed in 1997 to 69.3% in 2012.
Geographic inequalities in the one-year survival index are persistent: a clear North-South gradient existed in 1997, although this was less marked in 2012.
The pattern of a gradual increase in the one-year survival index with persistent geographic inequalities is similar for middle-aged (55 to 64 years) and elderly (75 to 99 years) patients.
In 2012, the England one-year survival index for all cancers remained markedly lower for elderly patients (57.2%) compared to middle-aged patients (76.7%).
Geographic inequalities in the one-year survival index in London are only slightly narrower than those observed for the whole of England.
2. Summary
This bulletin presents an index of survival for all cancers combined, at one year after diagnosis, for adults who were diagnosed during 1997 to 2012 and followed up to 31 December 2013. The index has been produced for patients living in the territories assigned to each of 211 Clinical Commissioning Groups (CCGs) in England.
Results for additional indices are also presented for patients diagnosed during the same period:
- A cancer survival index at both one and five years after diagnosis, for all cancers combined, for each of 25 NHS England Area Teams (ATs).
- A cancer survival index at both one and five years after diagnosis, for all cancers combined, for England as a whole.
Collaboration
This publication is produced in partnership with the Cancer Research UK Cancer Survival Group, at the London School of Hygiene and Tropical Medicine.
London School of Hygiene and Tropical Medicine

Download this image London School of Hygiene and Tropical Medicine
.gif (12.4 kB)3. Introduction
This bulletin presents an index of net survival at one year after diagnosis for all cancers combined, for each of the 211 Clinical Commissioning Groups (CCGs) in England. This index is designed as an overall measure of the effectiveness of cancer services at both local and national level. For Health Service Managers application, the index needs to reflect the overall outcome (effectiveness) of care for all cancer patients resident in the territory of a given CCG, and to relate to patients diagnosed in a single calendar year.
As a national surveillance tool of strategic value for government policy, the index also needs to provide a succinct national overview of changes in the geographic pattern of short-term survival for all cancers. At both local and national level, trends in the index should support assessment of the impact of earlier diagnosis, a key component of the National Awareness and Early Diagnosis Initiative (Anon. 2008; Richards, 2009a; Richards, 2009b).
Back to table of contents4. Survival index for all cancers combined
From 1997 to 2012 an index of one-year net survival (%) for all cancers combined was constructed for each of the 211 Clinical Commissioning Groups (CCGs) in England.
In comparing survival between CCGs and over time, it is crucial to take account of differences between CCGs in the profile of cancer patients by age, sex and cancer type. This is because net survival varies with age and sex, and especially between different cancers, and the profile of each of these factors for cancer patients within a given CCG can change over time. Standardisation for all three factors is essential to minimise bias and improve the interpretability of this all-cancers survival index. This approach is encapsulated in the survival index in this bulletin. The approach was developed to produce an index of short-term survival that could be used consistently from year-to-year for Primary Care Trusts (Office for National Statistics, 2012), which were replaced by CCGs on 1 April 2013.
A cancer survival index has also been constructed on the same basis for each of the 25 NHS Area Teams (ATs) in England over the 16 years 1997 to 2012, at one and five years after diagnosis. The territory of each CCG fits entirely within a given Area Team. Comparable survival index figures have also been constructed for each year for England as a whole.
Back to table of contents5. Survival index for three cancers combined
A separate survival index has also been constructed for three common cancers: breast (women), colorectal and lung, to offer the prospect of a simpler index. The index is presented at one year after diagnosis for each of the 211 CCGs, for the 25 ATs and for England as a whole, and for each year (1997 to 2012).
An index of survival at five years after diagnosis is also presented for each Area Team, and for England as a whole.
Back to table of contents6. Smoothed maps
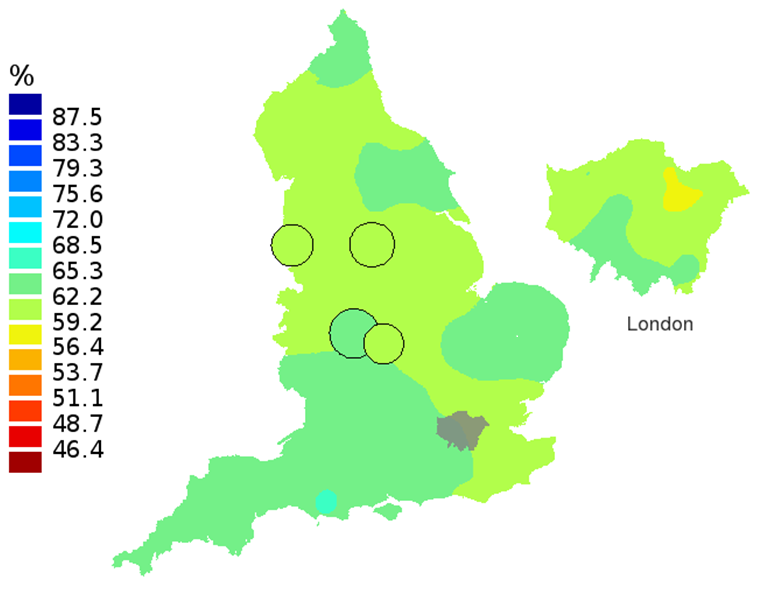
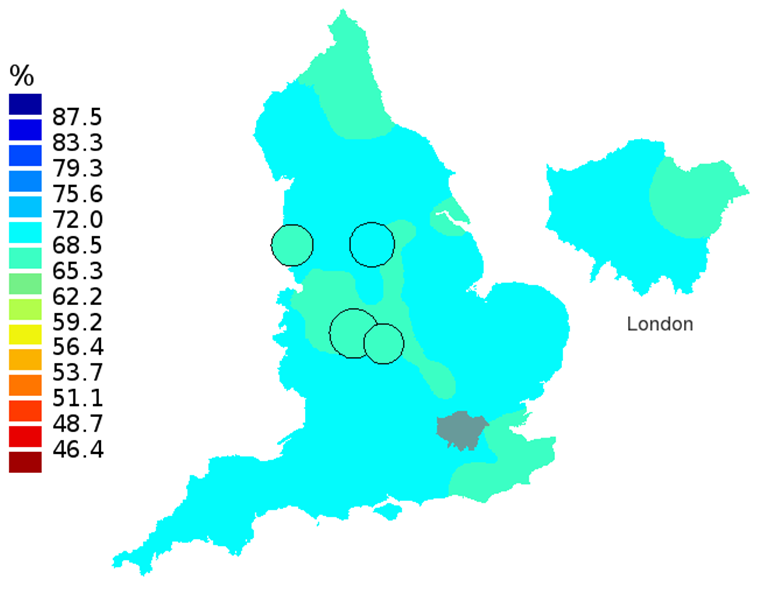
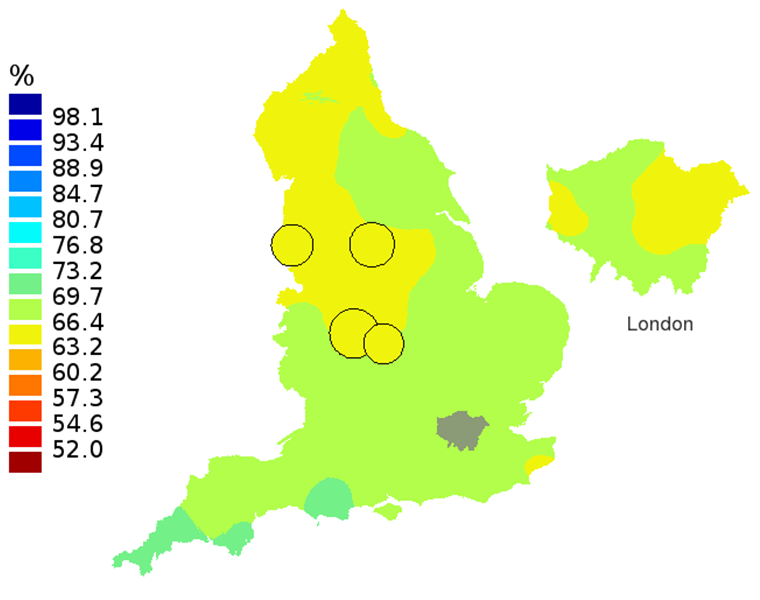
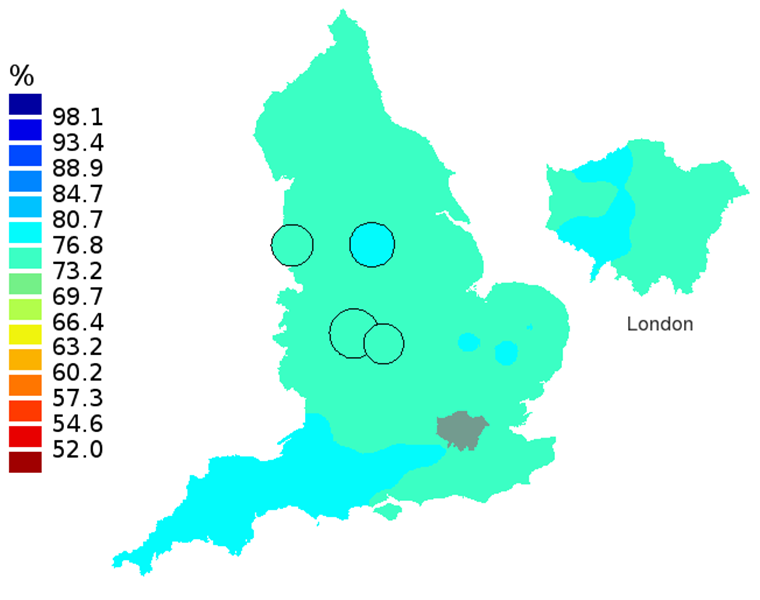
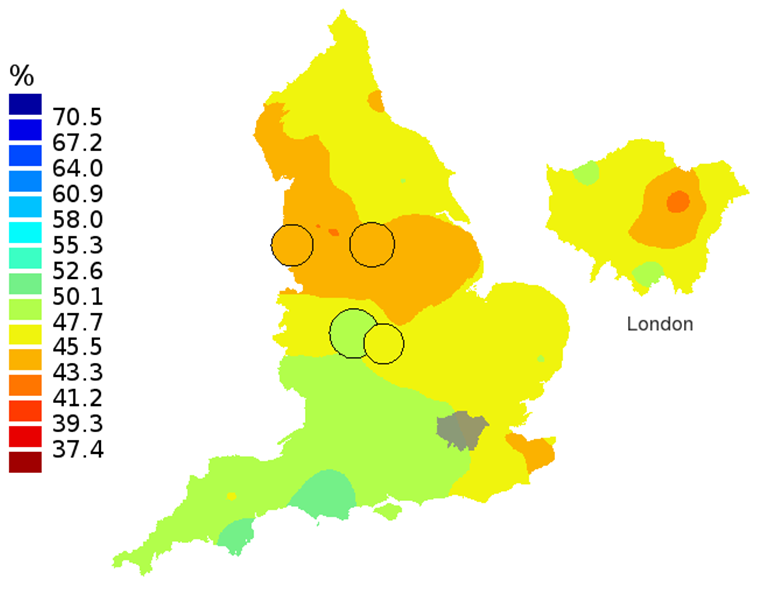
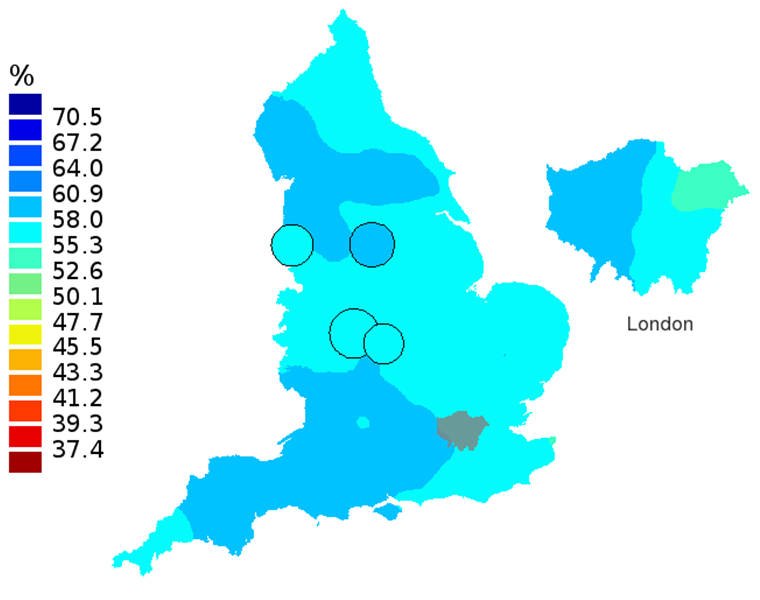
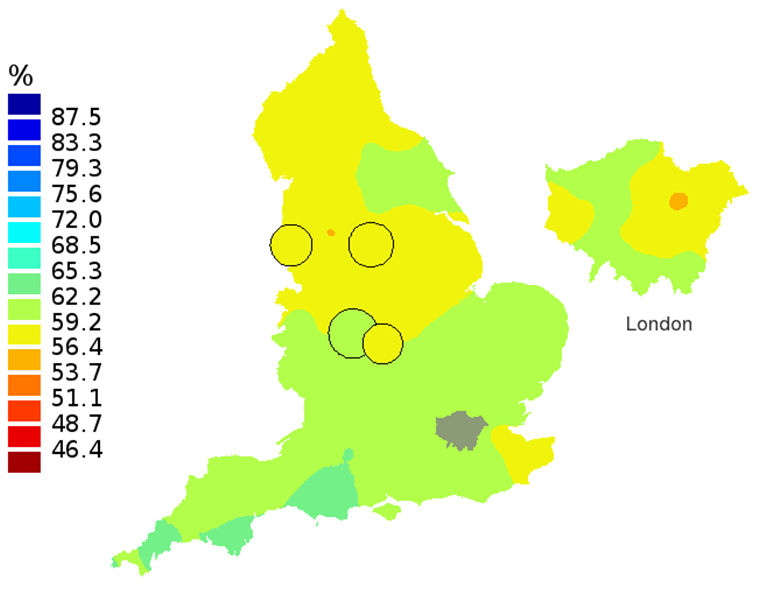
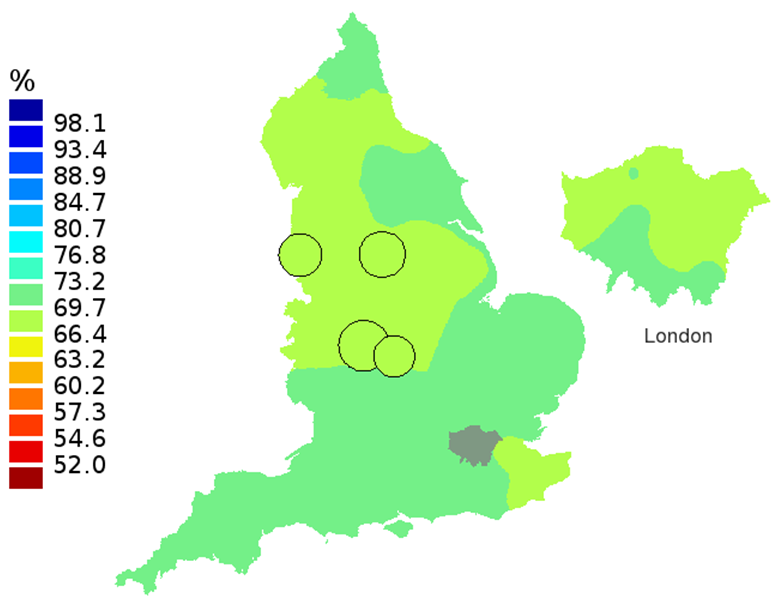
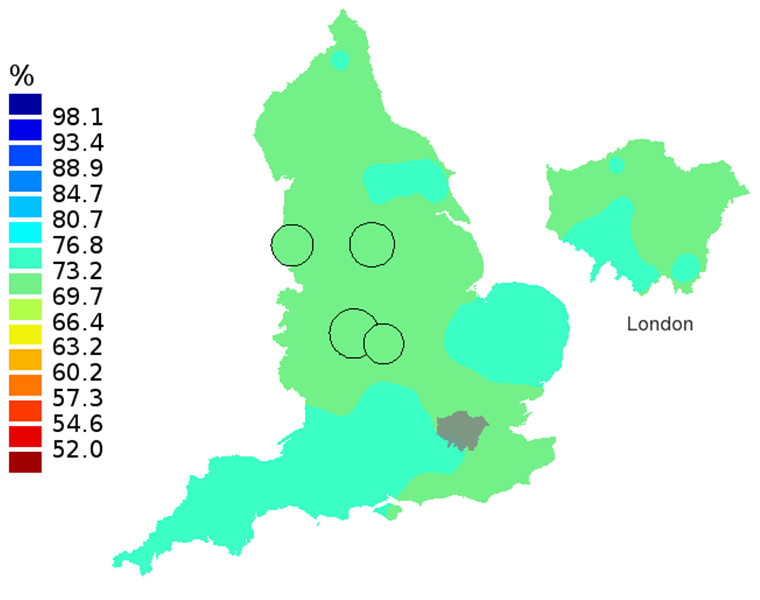
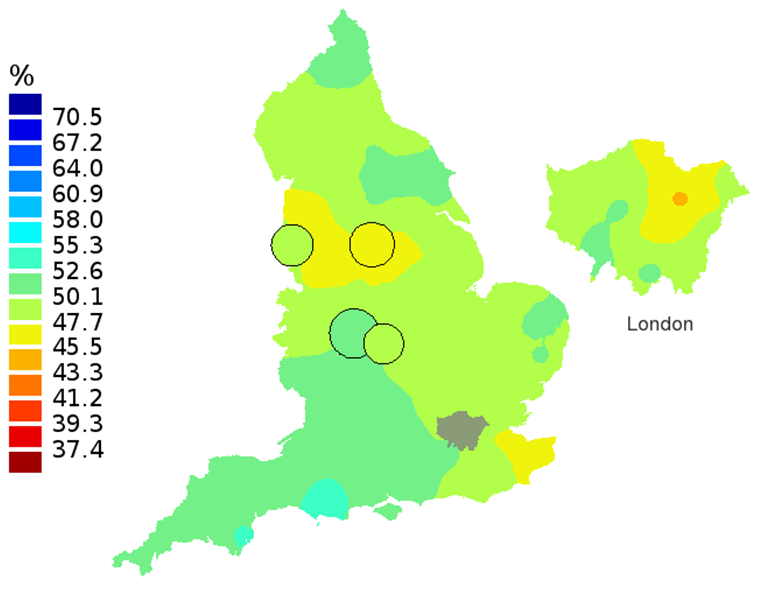
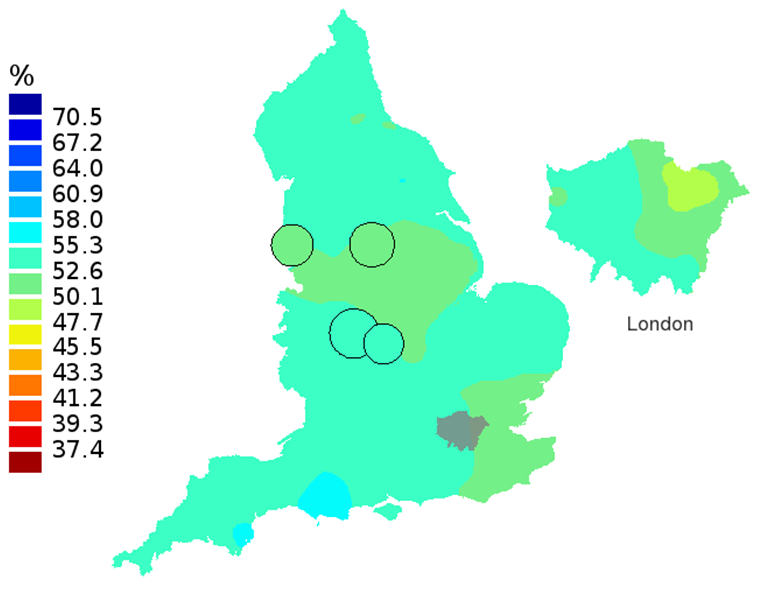
Smoothed maps of the survival index were constructed for each year in the 16-year period 1997–2012 to provide a visual impression of trends in the geographic pattern of one-year survival for all cancers combined across England. Examples are shown for selected years 1997, 2002, 2007 and 2012: one-year survival index for adults aged 15 to 99 years (Figure 1), patients aged 55 to 64 years (Figure 2) and patients aged 75 to 99 years (Figure 3).
In these maps, the CCG boundaries are not shown. The survival index at each point on the map is weighted by all other estimates within a radius of 150km, with weights inversely proportional to their distance. The circles on the maps represent the CCGs with the largest populations, for which survival estimates are statistically stable and are not included in the smoothing process. The purpose of these maps is to provide a ‘bird’s-eye’ view of geographic variation in cancer survival across the country, after elimination of random local fluctuations.
Back to table of contents7. Funnel plots
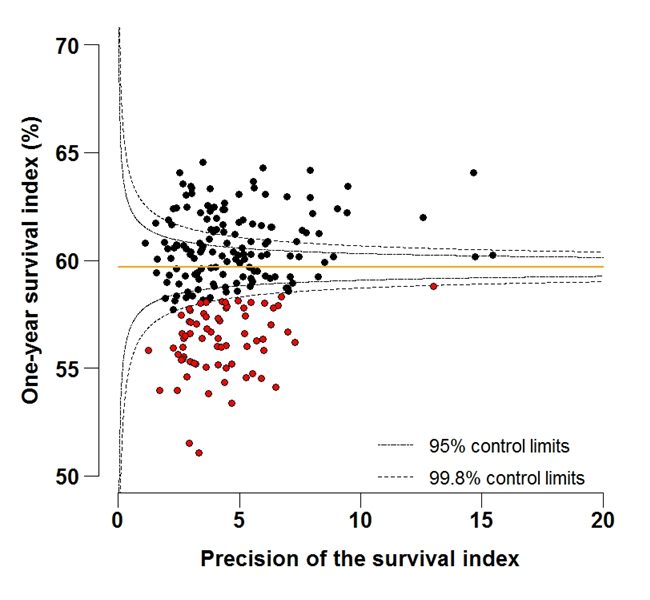
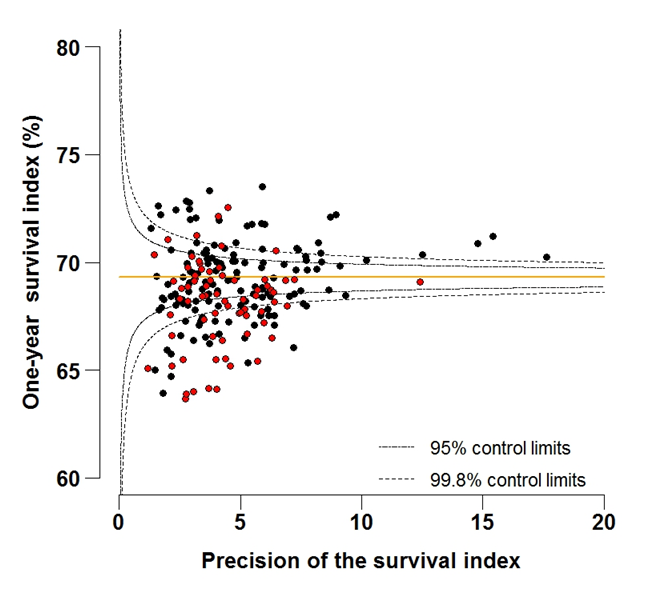
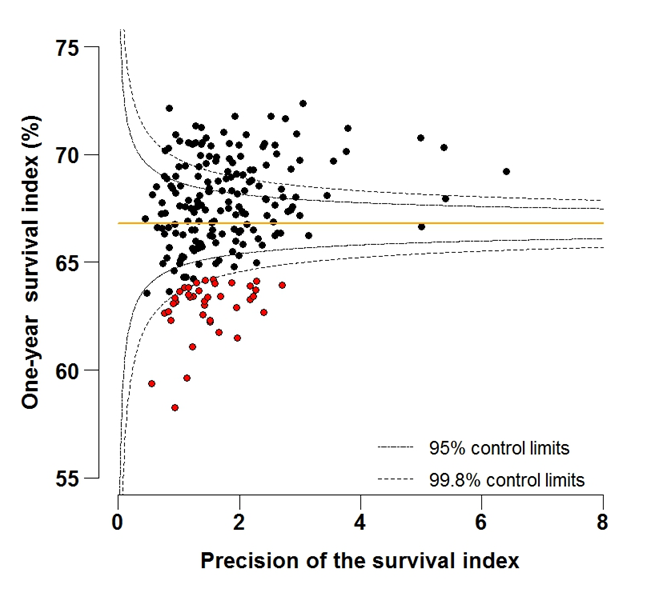
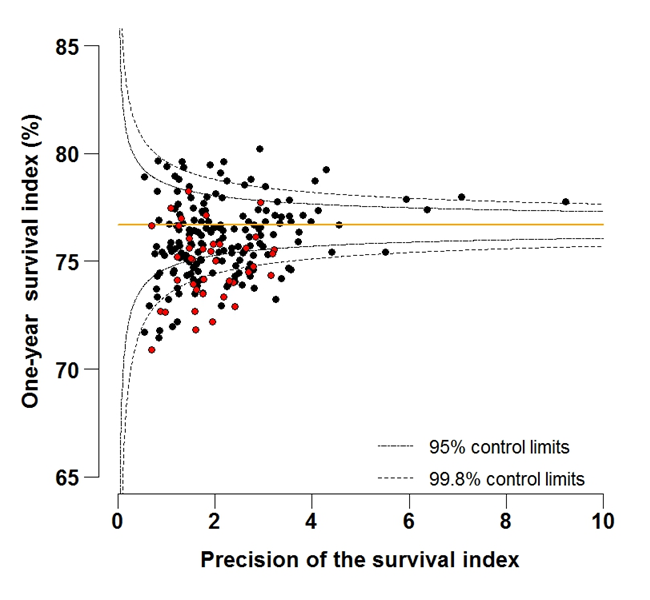
Funnel plots show how much a particular survival index deviates from the overall survival index for that year in England (the horizontal line in each plot), given the statistical precision of the index for each CCG. The precision is the inverse of the variance of the survival index. Funnel plots of the one-year survival index for all cancers combined are presented for all adult patients (aged 15 to 99 years) (Figure 4), for patients aged 55 to 64 years (Figure 5), and for patients aged 75 to 99 years (Figure 6). Each data point represents one CCG.
The two ‘control limits’, in the shape of a funnel around the horizontal line, represent approximately two (95% control limits) and three (99.8% control limits) standard deviations, respectively, above or below the national average. Data points that lie inside the control limits may be considered as within the range of geographical variation that could be expected by chance. Values of the survival index that fell below the control limits for 1997 are marked with a red dot. They represent the CCGs for which the cancer survival index was significantly lower than the national average for adults diagnosed in 1997, after taking account of differences between CCGs in the statistical precision of the index. These CCGs with ‘outlier’ values of the index for 1997 are also marked in red in the funnel plots for the last year of incidence 2012, to provide a visual indication of the extent to which the survival index in those CCGs has improved or remained consistently low over time. It should be noted that these ‘outlier’ values are not just the lowest values that would be obtained from a simple ranked list. Some of the lowest values of the index are still within the range of variation that could be expected by chance (that is, inside the control limits). These are generally for the smallest CCGs, in which the index has lower precision.
Table 8 (132.5 Kb Excel sheet) presents a list of the CCGs for which the 2012 one-year survival index for all cancers for adults aged 15 to 99 years (see Figure 4b in 'List of Figures - Funnel plots') fell either above or below the 99.8% control limits (and is therefore significantly different from the 2012 England average).
Back to table of contents8. Results
Table 1 (154 Kb Excel sheet) shows the mid-2012 estimates of the resident populations in each CCG (Office For National Statistics, 2013). CCG populations in 2012 ranged from 63,000 to 869,000, with a mean of 254,000.
Table 1 (154 Kb Excel sheet) also shows the number of patients included in the analyses for each CCG. Of the patients who were eligible for analysis, 3.5% were excluded because the cancer was only registered from a death certificate (DCO) and the survival time was therefore unknown. A further 0.3% were excluded because their vital status (whether alive, emigrated, dead or not traced) on 31 December 2013 was unknown, or because of duplicate registration, an invalid sequence of dates, or the patient could not be attributed to a CCG of residence at diagnosis. Patients with zero survival time (1.8% of all patients) were included in the analyses, and one day was added to their survival time. Records for multiple primary tumours were excluded (6.5%) to avoid in the estimation of the overall survival index. The analyses included 2,884,192 patients in total.
Estimates of the one-year survival index for all cancers combined are presented for each of the 211 Clinical Commissioning Groups in England, and for each year 1997 to 2012, for:
- all adults 15 to 99 years; Table 2 (443 Kb Excel sheet)
- patients aged 55 to 64 years Table 3 (443 Kb Excel sheet)
- patients aged 75 to 99 years Table 4 (443 Kb Excel sheet)
Estimates of the one-year survival index for three cancers (breast, colorectal and lung) are presented for each of the 211 Clinical Commissioning Groups in England, and for each year 1997 to 2012, for:
- all adults 15 to 99 years; Table 5 (454.5 Kb Excel sheet)
- patients aged 55 to 64 years Table 6 (454.5 Kb Excel sheet)
- patients aged 75 to 99 years Table 7 (454.5 Kb Excel sheet)
Differences between survival index estimates between age groups are taken as the arithmetic difference: for example, 12% is shown as 2% (not 20%) higher than 10%. Survival figures are rounded to one decimal place, but the differences are based on the exact underlying figures.
Commentary
For adults diagnosed in 2012, the one-year survival index in England for all cancers combined and for all ages was 69.3% (Table 2 (443 Kb Excel sheet)). This reflects a steady, continuing increase over the last 16 years, from 59.7% in 1997. For patients aged 55 to 64 years at diagnosis, the index increased from 66.8% in 1997, to 76.7% in 2012 (Table 3 (443 Kb Excel sheet)). The corresponding increase for patients aged 75 to 99 years was from 47.4% in 1997, to 57.2% for patients diagnosed in 2012 (Table 4 (443 Kb Excel sheet)).
For individual Clinical Commissioning Groups, the trends are generally similar to the overall national pattern, but the range of the survival index between CCGs for patients aged 15 to 99 is wide, from 51.1% to 64.6% in 1997, to 63.7% to 73.5% in 2012 (Figure 4a-4b).
In 2012, the England one-year survival index for all cancers remained markedly lower for elderly patients (57.2%), compared to middle-aged patients (76.7%). This pattern of lower survival for elderly patients compared to middle-aged patients is evident for all CCGs. The arithmetic difference across all CCGs ranged from 13.4% to 24.0% lower for elderly compared to middle-aged patients, with an average difference across all CCGs of 18.2%.
The north-south gradient in one-year survival is a persistent feature of these data, although it has attenuated somewhat between 1997 and 2012 (Figure 1a-1d). Among CCGs in London, the geographic inequalities in the one-year survival index are only slightly narrower than those observed for the whole of England, with lower survival in the north east of the city. These differences are less marked in 2012 than 1997.
Caution is required in interpretation of this overall index of short-term cancer survival for CCGs. The index does not reflect the prospects of one-year survival for any individual cancer patient. It should not be interpreted as the only indicator of performance, but in conjunction with other information available to the CCG. It should be seen as a guide and raise questions about the potential for improvement. The index is designed for use as a tool for public health management of cancer care, both at local and at national level. Not all cancer patients who live (or lived) in the territory assigned to a CCG are (or were) registered with a GP practice included in that CCG.
The index, nevertheless, provides a convenient, single number that summarises the overall patterns of cancer survival in each CCG, in each calendar year, for men and women, young and old, and for a wide range of cancers with very differenct survival. Survival for most cancers is either stable or rising steadily from year to year (Rachet et al. 2009). This trend is reflected in the values of the index in the tables. However, the patterns of cancer occurrence by age, sex and type of cancer can shift quite quickly over time, especially in small areas. The survival index is designed to reflect real progress (or otherwise) by providing a summary measure of cancer survival that adjusts for any such shifts. In short, the index is intended to change only if cancer survival itself actually changes. It is designed for long-term monitoring of progress in overall cancer survival.
Back to table of contents9. List of Figures - Smoothed maps
Figure 1A: Smoothed maps of the one-year survival index (%) for all cancers combined in 211 Clinical Commissioning Groups: England, 1997, adults aged 15-99 years

Source: Office for National Statistics, London School of Hygiene and Tropical Medicine
Notes:
- The circles on the maps represent the CCGs with the largest populations, for which survival estimates are statistically stable and are not included in the smoothing process.
Download this image Figure 1A: Smoothed maps of the one-year survival index (%) for all cancers combined in 211 Clinical Commissioning Groups: England, 1997, adults aged 15-99 years
.png (87.4 kB)
Figure 1B: Smoothed maps of the one-year survival index (%) for all cancers combined in 211 Clinical Commissioning Groups: England, 2002, adults aged 15-99 years
Source: Office for National Statistics
Notes:
- The circles on the maps represent the CCGs with the largest populations, for which survival estimates are statistically stable and are not included in the smoothing process.
Download this image Figure 1B: Smoothed maps of the one-year survival index (%) for all cancers combined in 211 Clinical Commissioning Groups: England, 2002, adults aged 15-99 years
.png (87.2 kB)
Figure 1C: Smoothed maps of the one-year survival index (%) for all cancers combined in 211 Clinical Commissioning Groups: England, 2007, adults aged 15-99 years

Source: Office for National Statistics, London School of Hygiene and Tropical Medicine
Notes:
- The circles on the maps represent the CCGs with the largest populations, for which survival estimates are statistically stable and are not included in the smoothing process.
Download this image Figure 1C: Smoothed maps of the one-year survival index (%) for all cancers combined in 211 Clinical Commissioning Groups: England, 2007, adults aged 15-99 years
.png (85.0 kB)
Figure 1D: Smoothed maps of the one-year survival index (%) for all cancers combined in 211 Clinical Commissioning Groups: England, 2012, adults aged 15-99 years
Source: Office for National Statistics
Notes:
- The circles on the maps represent the CCGs with the largest populations, for which survival estimates are statistically stable and are not included in the smoothing process.
Download this image Figure 1D: Smoothed maps of the one-year survival index (%) for all cancers combined in 211 Clinical Commissioning Groups: England, 2012, adults aged 15-99 years
.png (79.4 kB)
Figure 2A: Smoothed maps of the one-year survival index (%) for all cancers combined in 211 Clinical Commissioning Groups: England, 1997, patients aged 55-64 years
Source: Office for National Statistics, London School of Hygiene and Tropical Medicine
Notes:
- The circles on the maps represent the CCGs with the largest populations, for which survival estimates are statistically stable and are not included in the smoothing process.
Download this image Figure 2A: Smoothed maps of the one-year survival index (%) for all cancers combined in 211 Clinical Commissioning Groups: England, 1997, patients aged 55-64 years
.png (86.6 kB)
Figure 2B: Smoothed maps of the one-year survival index (%) for all cancers combined in 211 Clinical Commissioning Groups: England, 2002, patients aged 55-64 years

Source: Office for National Statistics, London School of Hygiene and Tropical Medicine
Notes:
- The circles on the maps represent the CCGs with the largest populations, for which survival estimates are statistically stable and are not included in the smoothing process.
Download this image Figure 2B: Smoothed maps of the one-year survival index (%) for all cancers combined in 211 Clinical Commissioning Groups: England, 2002, patients aged 55-64 years
.png (90.1 kB)
Figure 2C: Smoothed maps of the one-year survival index (%) for all cancers combined in 211 Clinical Commissioning Groups: England, 2007, patients aged 55-64 years

Source: Office for National Statistics, London School of Hygiene and Tropical Medicine
Notes:
- The circles on the maps represent the CCGs with the largest populations, for which survival estimates are statistically stable and are not included in the smoothing process.
Download this image Figure 2C: Smoothed maps of the one-year survival index (%) for all cancers combined in 211 Clinical Commissioning Groups: England, 2007, patients aged 55-64 years
.png (87.6 kB)
Figure 2D: Smoothed maps of the one-year survival index (%) for all cancers combined in 211 Clinical Commissioning Groups: England, 2012, patients aged 55-64 years
Source: Office for National Statistics, London School of Hygiene and Tropical Medicine
Notes:
- The circles on the maps represent the CCGs with the largest populations, for which survival estimates are statistically stable and are not included in the smoothing process.
Download this image Figure 2D: Smoothed maps of the one-year survival index (%) for all cancers combined in 211 Clinical Commissioning Groups: England, 2012, patients aged 55-64 years
.png (79.2 kB)
Figure 3A: Smoothed maps of the one-year survival index (%) for all cancers combined in 211 Clinical Commissioning Groups: England, 1997, patients aged 75-99 years
Source: Office for National Statistics, London School of Hygiene and Tropical Medicine
Notes:
- The circles on the maps represent the CCGs with the largest populations, for which survival estimates are statistically stable and are not included in the smoothing process.
Download this image Figure 3A: Smoothed maps of the one-year survival index (%) for all cancers combined in 211 Clinical Commissioning Groups: England, 1997, patients aged 75-99 years
.png (90.4 kB)
Figure 3B: Smoothed maps of the one-year survival index (%) for all cancers combined in 211 Clinical Commissioning Groups: England, 2002, patients aged 75-99 years

Source: Office for National Statistics, London School of Hygiene and Tropical Medicine
Notes:
- The circles on the maps represent the CCGs with the largest populations, for which survival estimates are statistically stable and are not included in the smoothing process.
Download this image Figure 3B: Smoothed maps of the one-year survival index (%) for all cancers combined in 211 Clinical Commissioning Groups: England, 2002, patients aged 75-99 years
.png (92.7 kB)
Figure 3C: Smoothed maps of the one-year survival index (%) for all cancers combined in 211 Clinical Commissioning Groups: England, 2007, patients aged 75-99 years

Source: Office for National Statistics, London School of Hygiene and Tropical Medicine
Notes:
- The circles on the maps represent the CCGs with the largest populations, for which survival estimates are statistically stable and are not included in the smoothing process.
Download this image Figure 3C: Smoothed maps of the one-year survival index (%) for all cancers combined in 211 Clinical Commissioning Groups: England, 2007, patients aged 75-99 years
.png (85.9 kB)
Figure 3D: Smoothed maps of the one-year survival index (%) for all cancers combined in 211 Clinical Commissioning Groups: England, 2012, patients aged 75-99 years
Source: Office for National Statistics, London School of Hygiene and Tropical Medicine
Notes:
- The circles on the maps represent the CCGs with the largest populations, for which survival estimates are statistically stable and are not included in the smoothing process.
Download this image Figure 3D: Smoothed maps of the one-year survival index (%) for all cancers combined in 211 Clinical Commissioning Groups: England, 2012, patients aged 75-99 years
.png (76.7 kB)10. List of Figures - Funnel plots
Figure 4A: Funnel plot of the one-year survival index (%) for all cancers combined in 211 Clinical Commissioning Groups: England, 1997, all adults (aged 15-99 years)
Source: Office for National Statistics, London School of Hygiene and Tropical Medicine
Download this image Figure 4A: Funnel plot of the one-year survival index (%) for all cancers combined in 211 Clinical Commissioning Groups: England, 1997, all adults (aged 15-99 years)
.png (94.7 kB) .xls (43.5 kB)
Figure 4B: Funnel plot of the one-year survival index (%) for all cancers combined in 211 Clinical Commissioning Groups: England, 2012, all adults (aged 15-99 years)
Source: Office for National Statistics, London School of Hygiene and Tropical Medicine
Download this image Figure 4B: Funnel plot of the one-year survival index (%) for all cancers combined in 211 Clinical Commissioning Groups: England, 2012, all adults (aged 15-99 years)
.png (115.4 kB) .xls (47.6 kB)
Figure 5A: Funnel plot of the one-year survival index (%) for all cancers combined in 211 Clinical Commissioning Groups: England, 1997, patients aged 55-64 years
Source: Office for National Statistics, London School of Hygiene and Tropical Medicine
Download this image Figure 5A: Funnel plot of the one-year survival index (%) for all cancers combined in 211 Clinical Commissioning Groups: England, 1997, patients aged 55-64 years
.png (110.4 kB) .xls (45.1 kB)
Figure 5B: Funnel plot of the one-year survival index (%) for all cancers combined in 211 Clinical Commissioning Groups: England, 2012, patients aged 55-64 years
Source: Office for National Statistics, London School of Hygiene and Tropical Medicine
Download this image Figure 5B: Funnel plot of the one-year survival index (%) for all cancers combined in 211 Clinical Commissioning Groups: England, 2012, patients aged 55-64 years
.png (109.3 kB) .xls (45.1 kB)
Figure 6A: Funnel plot of the one-year survival index (%) for all cancers combined in 211 Clinical Commissioning Groups: England, 1997, patients aged 75-99 years
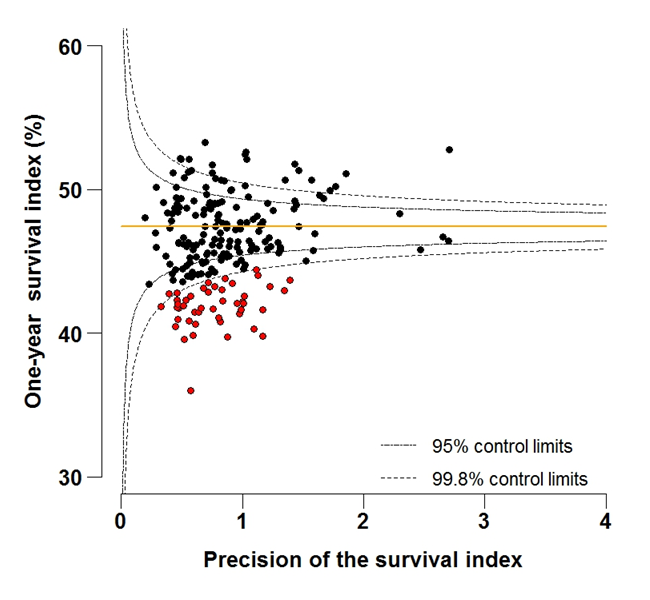
Source: Office for National Statistics, London School of Hygiene and Tropical Medicine
Download this image Figure 6A: Funnel plot of the one-year survival index (%) for all cancers combined in 211 Clinical Commissioning Groups: England, 1997, patients aged 75-99 years
.png (105.7 kB) .xls (44.5 kB)
Figure 6B: Funnel plot of the one-year survival index (%) for all cancers combined in 211 Clinical Commissioning Groups: England, 2012, patients aged 75-99 years
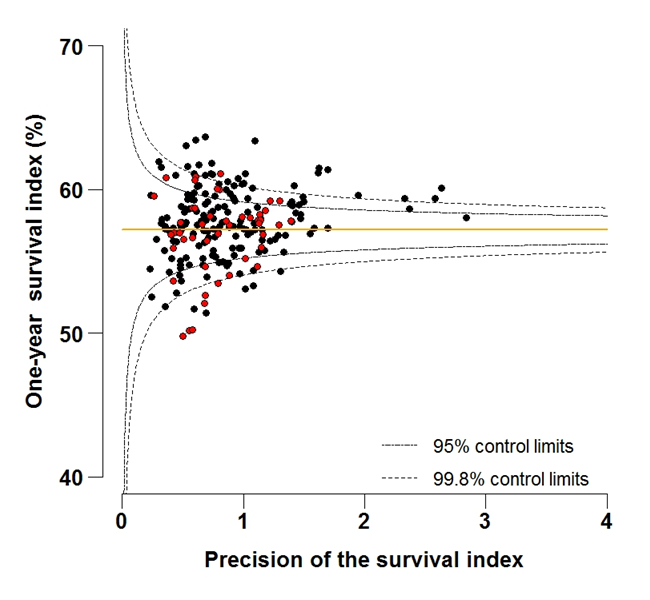
Source: Office for National Statistics, London School of Hygiene and Tropical Medicine
Download this image Figure 6B: Funnel plot of the one-year survival index (%) for all cancers combined in 211 Clinical Commissioning Groups: England, 2012, patients aged 75-99 years
.png (105.0 kB) .xls (43.0 kB)11. Notes on methodology
The approach adopted to compute the index is an extension of conventional standardisation by age, to include both sex and the type of cancer.
We have avoided ranking CCGs from the highest to the lowest on the basis of their survival index in any given year, because:
the goal is to provide local information to support long-term improvements in cancer control
if the highest value of the index is 65% (for example) and the lowest is 50% (a 15% difference), then with 211 CCGs, a difference of just 1% could mean that the rank of a CCG may change by 10, and by 30 or more in the middle of the range, where differences in the value of the index are very small
the lowest values of the index in a ranked bar-chart for a given year are not necessarily significantly different from what might be expected, because a bar-chart does not take account of the precision of individual estimates
some year-to-year fluctuation of the index must be expected due to chance alone: if a low value for 2012 (for example) were the only outlying value for a given CCG in 16 years, and there was no trend for the index in that CCG to fall progressively below the national average, then the low value in 2012 might simply represent random fluctuation
trends also matter. A CCG for which the tables show that the survival index is consistently lower than average should be considering why survival in its area might be low
12. Users and uses
Key users of cancer survival estimates include:
the Department of Health
academics and researchers
cancer charities
cancer registries
other government organisations
researchers within ONS
the media
the general public
The Department of Health uses cancer survival figures to brief government ministers, and as part of the evidence to inform cancer policy and programmes; in drives to improve cancer survival, for example. Cancer survival estimates, published by ONS, are also included as indicators in the NHS Outcomes Framework and the Clinical Commissioning Group Indicator Set, which are used to hold the NHS and commissioners to account. Academics and researchers use the figures to inform their own research. Similarly, Public Health England and other government organisations use the figures to carry out individual and collaborative projects. Charities use the data so they can provide reliable and accessible information about cancer to a wide range of groups, including patients and health professionals via health awareness campaigns and cancer information leaflets/web pages. Researchers within ONS use the data to support further research and to publish alongside other National Statistics.
Back to table of contents13. Policy context
In ‘Improving Outcomes: A Strategy for Cancer’ (January 2011), the Department of Health stated that, although improvements have been made in the quality of cancer services in England, a significant gap remains in survival compared with the European average. Survival estimates for cervical, colorectal and breast cancer are some of the lowest among Member States of the Organisation for Economic Co-operation and Development (OECD) (figures for cancer survival in OECD countries are available from the OECD website). The strategy document sets out how the Department of Health aims to improve outcomes for all cancer patients and improve cancer survival, with the aim of saving an additional 5,000 lives every year by 2014/15.
Outcomes strategies set out how the NHS, public health and social care services will contribute to the ambitions for progress agreed with the Secretary of State in each of the high-level outcomes frameworks. The indicators set for the National Health Service (NHS) Outcomes Framework 2011/12 focus on measuring health outcomes and include one- and five-year net survival from colorectal, breast and lung cancers.
Back to table of contents15. Acknowledgements
We are grateful to many persons without whom this work would not have been possible. The continuing efforts of the National Cancer Registration Service in England to collect data on all cancer patients to the highest standards of quality and completeness are crucial. ONS collates these data, performs additional quality control and links them to information about each patient’s vital status in the National Cancer Registry.
We gratefully acknowledge Mr Toni Patama and Professor Eero Pukkala at the Finnish Cancer Registry, who kindly provided the software with which the smoothed maps were produced, and who assisted in their production.
Back to table of contents