1. Key findings
One-year net survival from cancers of the oesophagus, stomach, colon, lung, breast (women) and cervix has improved by between 3% and 19% for adults diagnosed in England in 2011, compared to those diagnosed in 1996
Five-year net survival for these same cancers has improved by between 2% and 9% for adults diagnosed in 2006, compared to those diagnosed in 1996
For women diagnosed with breast cancer in 2011, there was very little variation in one-year survival across the 25 NHS England Area Teams: the national average value was 96.4%, and the range between the highest and lowest values was only 1.3%
For five-year survival for women diagnosed with breast cancer in 2006, the geographic variation around the national average (84.1%) was slightly wider, at 4.0%
Disparities in net survival across the 25 NHS England Area Teams were highest for one-year net survival for cancers of the oesophagus (men), stomach, colon (women) and lung (women) in 2011, with differences of over 10% between Area Teams. These disparities were less marked for five-year net survival
2. Summary
This report presents one-year and five-year age-standardised net survival estimates for the 25 NHS England Area Teams, for patients who were diagnosed with a cancer of the oesophagus, stomach, colon, lung, breast (women) or cervix during 1996–2011 and followed up to 31 December 2012 (see Background Notes 1−3). One-year survival estimates are reported for patients diagnosed in 1996, 2001, 2006 and 2011, and five-year survival for those diagnosed in 1996, 2001 and 2006.
Back to table of contents3. Results
The 25 NHS England Area Teams were created on 1 April 2013. For the purpose of these analyses, patients have been assigned to the Area Team that includes their residence when they were diagnosed between 1996 and 2011.
Estimates of one-year and five-year age-standardised net survival (%) are presented for each of the six cancers in tables and charts for each NHS England Area Team, by sex and calendar period. The survival estimates are age-standardised to compensate for differences in the age profile of cancer patients between Area Teams, and for changes in these age profiles over time (see Background Note 5).
One-year survival is above 60% for cancers of the colon, breast and cervix, and five-year survival for these cancers is above 45% (Figures 1A and 1B). For cancers of the oesophagus, stomach and lung, however, one-year survival is below 50% and five-year survival below 20%.
Figure 1A: One-year age-standardised net survival (%) for adults (1) diagnosed with one of six cancers: England, 1996–2011, by year of diagnosis and sex
Source: Office for National Statistics
Notes:
- Adults aged 15-99
Download this chart Figure 1A: One-year age-standardised net survival (%) for adults (1) diagnosed with one of six cancers: England, 1996–2011, by year of diagnosis and sex
Image .csv .xls
Figure 1B: Five-year age-standardised net survival (%) for adults (1) diagnosed with one of six cancers: England, 1996–2006 by year of diagnosis and sex
Source: Office for National Statistics
Notes:
- Adults aged 15-99
Download this chart Figure 1B: Five-year age-standardised net survival (%) for adults (1) diagnosed with one of six cancers: England, 1996–2006 by year of diagnosis and sex
Image .csv .xlsAt the national level an upward trend in net survival was observed for all six cancers. The largest improvement in one-year survival among men occurred for cancers of the oesophagus, where survival increased by 19% from 26.7% for those diagnosed in 1996 to 45.4% for those diagnosed in 2011. Five-year survival for men with colon cancer increased by 8% from 45.2% for those diagnosed in 1996 to 53.4 % for those diagnosed in 2006. For women the largest improvement in one-year survival was for cancer of the lung, where survival increased by 13% from 21.9% for those diagnosed in 1996 to 34.7% for those diagnosed in 2011. Five-year survival for women increased the most for those diagnosed with breast cancer, increasing by 9% from 75.2% in 1996 to 84.1% in 2006.
The range in one-year survival between NHS England Area Teams with the highest and lowest survival in 2011 was widest for men diagnosed with stomach cancer at 14.2% and narrowest for women diagnosed with breast cancer at 1.3% (Table 1A). For five-year survival the range between NHS England Area Teams in 2006 was widest for women diagnosed with colon cancer at 12.0% and narrowest for men diagnosed with lung cancer at 3.7% (Table 1B).
These estimates should not be used to rank NHS England Area Teams by their survival, because a change of just 1 or 2% may radically alter the ranking of a given Area Team, especially where the range of estimates is very narrow.
Figure 2 presents a map of the 25 NHS England Area Teams. The geographic patterns of one-year survival (patients diagnosed in 2011) for cancer of the oesophagus, stomach, colon, lung, breast (women) and cervix are mapped in Figures 3A, 4A, 5A, 6A, 7A and 8A respectively. Comparable maps for five-year survival (patients diagnosed in 2006) are mapped in Figures 3B, 4B, 5B, 6B, 7B and 8B respectively.
Reference files presenting results for one-year and five-year net survival by NHS England Area Team are available to download for cancer of the oesophagus (393.5 Kb Excel sheet), stomach (364.5 Kb Excel sheet), colon (357.5 Kb Excel sheet), lung (341.5 Kb Excel sheet), breast (women) (235 Kb Excel sheet) and cervix (227.5 Kb Excel sheet).
Table 1A: Range in one-year age-standardised net survival between NHS England Area Team, England, adults(1) diagnosed with one of six cancers 1996−2011, by year of diagnosis and sex
| Range % | ||||||
| ICD-10 Code | Site description | Sex | Year | |||
| 1996 | 2001 | 2006 | 2011 | |||
| C15 | Oesophagus | Men | 11.2 | 12.5 | 10.4 | 10.9 |
| Women | 13.7 | 13.9 | 9.5 | 9.5 | ||
| C16 | Stomach | Men | 9.2 | 13.3 | 10.1 | 14.2 |
| Women | 15.5 | 11.3 | 10.3 | 11.3 | ||
| C18 | Colon | Men | 11.7 | 11.0 | 8.0 | 7.8 |
| Women | 15.8 | 9.8 | 9.2 | 10.9 | ||
| C33, C34 | Lung | Men | 7.6 | 5.9 | 5.8 | 6.3 |
| Women | 9.1 | 8.5 | 8.2 | 11.1 | ||
| C50 | Breast | Women | 5.9 | 4.3 | 2.4 | 1.3 |
| C53 | Cervix | Women | 10.8 | 7.4 | 6.1 | 7.8 |
| Source: Office for National Statistics | ||||||
| Notes: | ||||||
| 1. Adults aged 15-99 | ||||||
Download this table Table 1A: Range in one-year age-standardised net survival between NHS England Area Team, England, adults(1) diagnosed with one of six cancers 1996−2011, by year of diagnosis and sex
.xls (34.8 kB)
Table 1B: Range in five-year age-standardised net survival between NHS England Area Team, England, adults(1) diagnosed with one of six cancers 1996−2006 by year of diagnosis and sex
| Range % | |||||
| ICD-10 Code | Site description | Sex | Year | ||
| 1996 | 2001 | 2006 | |||
| C15 | Oesophagus | Men | 6.4 | 6.8 | 6.2 |
| Women | 4.1 | 9.5 | 4.5 | ||
| C16 | Stomach | Men | 7.3 | 9.2 | 8.7 |
| Women | 9.9 | 6.6 | 8.2 | ||
| C18 | Colon | Men | 16.3 | 10.0 | 9.8 |
| Women | 17.3 | 12.6 | 12.0 | ||
| C33, C34 | Lung | Men | 3.9 | 3.9 | 3.7 |
| Women | 4.7 | 5.2 | 4.5 | ||
| C50 | Breast | Women | 10.0 | 5.5 | 4.0 |
| C53 | Cervix | Women | 12.5 | 11.0 | 9.5 |
| Source: Office for National Statistics | |||||
| Notes: | |||||
| 1. Adults aged 15-99 | |||||
Download this table Table 1B: Range in five-year age-standardised net survival between NHS England Area Team, England, adults(1) diagnosed with one of six cancers 1996−2006 by year of diagnosis and sex
.xls (34.8 kB)4. NHS England area team boundaries, 2013
Figure 2: NHS England area team boundaries, 2013
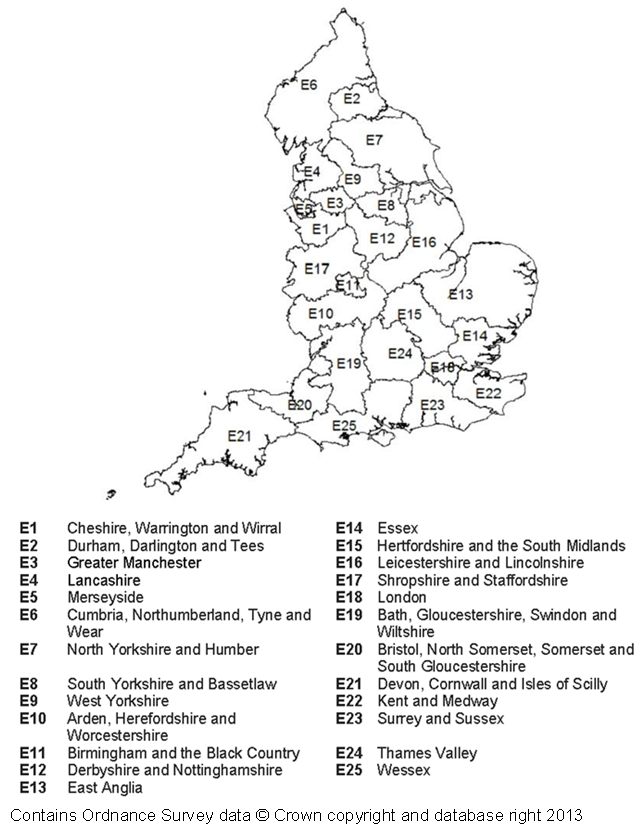
Source: Office for National Statistics
Download this image Figure 2: NHS England area team boundaries, 2013
.png (199.7 kB)
5. Oesophageal cancer
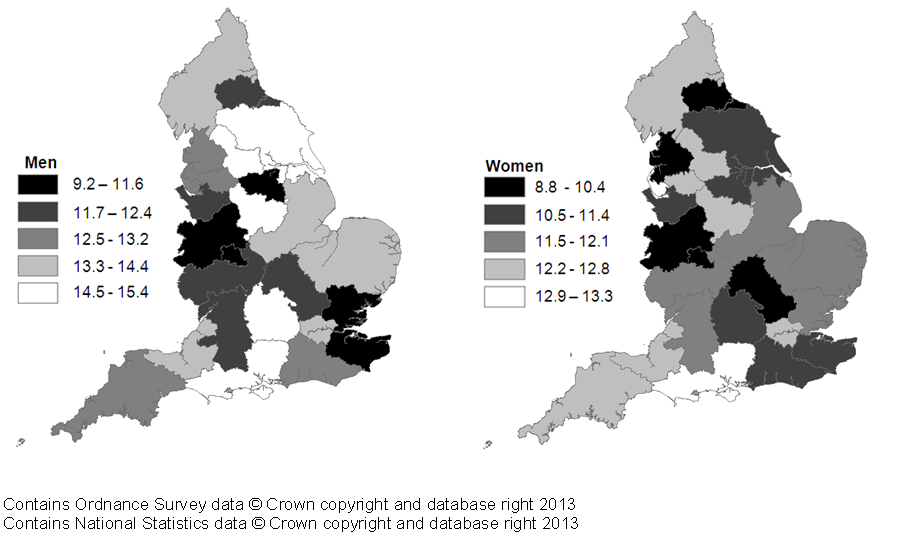
One-year age-standardised net survival improved considerably for patients diagnosed between 1996 and 2011, however survival was still low for patients diagnosed in 2011 and ranged between 38.8% and 49.6% for men and between 33.0% and 42.5% for women. One-year age-standardised net survival doubled in four NHS England Area Teams for men: Durham, Darlington and Tees; Greater Manchester; South Yorkshire and Bassetlaw; and Arden, Herefordshire and Worcestershire. One-year age-standardised net survival doubled in three NHS England Area Teams for women: Cheshire; Warrington and Wirral; Greater Manchester; and Merseyside (Tables and Figures A1 and A2 (393.5 Kb Excel sheet)). Five-year age standardised net survival ranged between 9.2% and 15.4% for men and 8.8% and 13.3% for women. Statistically significant improvements in five-year age-standardised net survival between NHS England Area Teams ranged between 4.2% and 9.1% in men and 3.8% and 8.3% in women (Tables and Figures A3 and A4 (393.5 Kb Excel sheet)).
Figure 3A: One-year age-standardised net survival (%) from oesophageal cancer for patients diagnosed 2011, by NHS England area teams and sex

Source: Office for National Statistics
Download this image Figure 3A: One-year age-standardised net survival (%) from oesophageal cancer for patients diagnosed 2011, by NHS England area teams and sex
.png (109.3 kB)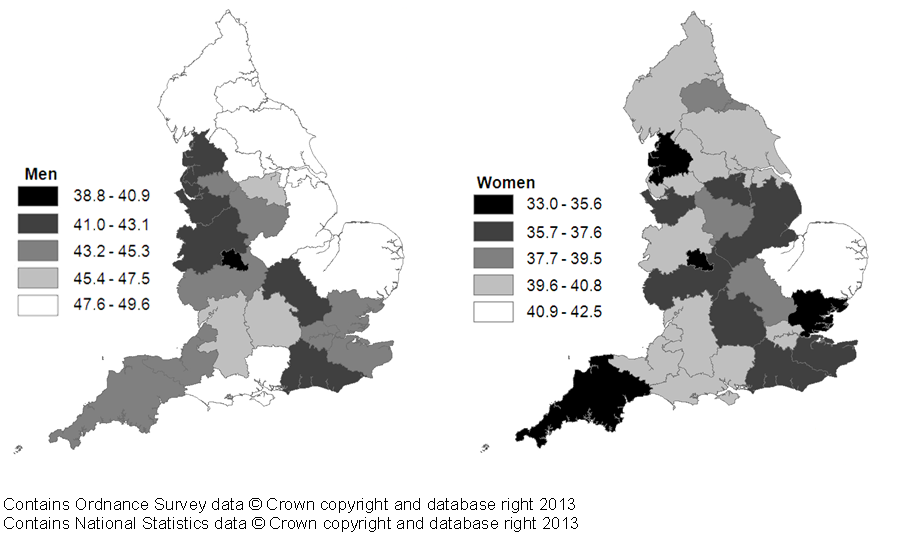
Figure 3B: Five-year age-standardised net survival (%) from oesophageal cancer for patients diagnosed 2006, by NHS England area teams and sex
Source: Office for National Statistics
Download this image Figure 3B: Five-year age-standardised net survival (%) from oesophageal cancer for patients diagnosed 2006, by NHS England area teams and sex
.png (102.4 kB)
6. Stomach cancer
One-year age-standardised net survival ranged between 38.8% and 52.9% in men and between 35.0% and 46.3% in women. Statistically significant improvements in one-year age-standardised net survival for men diagnosed in 2011 compared to those diagnosed in 1996 varied between NHS England Area Teams ranging from 6.9% to 19.6% (Tables and Figures B1 and B2 (364.5 Kb Excel sheet)). Five-year age-standardised net survival doubled in three NHS England Area teams for men between 1996 and 2006: Cumbria, Northumberland, Tyne and Wear; West Yorkshire; and Bristol, North Somerset, Somerset and South Gloucestershire. Both one and five-year net survival doubled for women in the South Yorkshire and Bassetlaw NHS England Area team. Five-year age-standardised net survival ranged between 13.0% and 21.6% for men and between 13.2% and 21.4% (Tables and Figures B3 and B4 (364.5 Kb Excel sheet)).
Figure 4A: One-year age-standardised net survival (%) from stomach cancer for patients diagnosed 2011, by NHS England area teams and sex

Source: Office for National Statistics
Download this image Figure 4A: One-year age-standardised net survival (%) from stomach cancer for patients diagnosed 2011, by NHS England area teams and sex
.png (108.2 kB)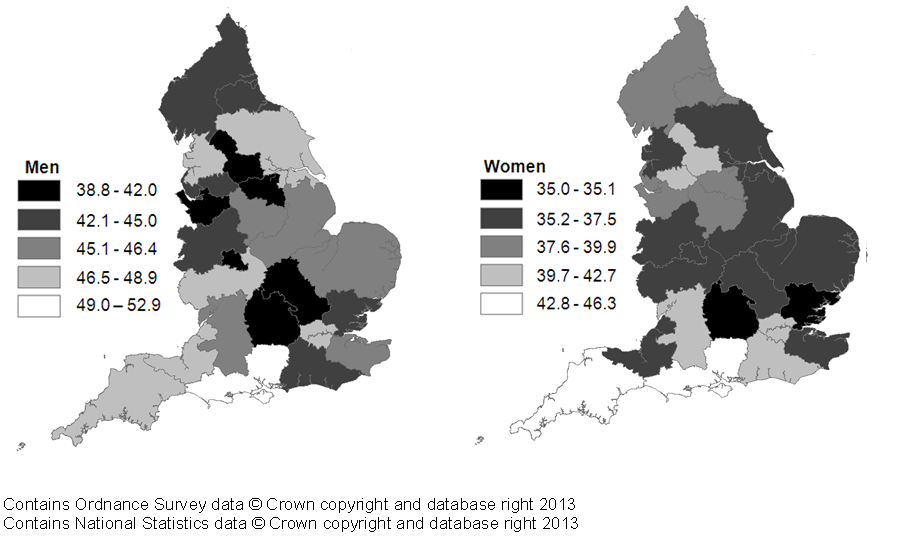
Figure 4B: Five-year age-standardised net survival (%) from stomach cancer for patients diagnosed 2006, by NHS England area teams and sex

Source: Office for National Statistics
Download this image Figure 4B: Five-year age-standardised net survival (%) from stomach cancer for patients diagnosed 2006, by NHS England area teams and sex
.png (102.3 kB)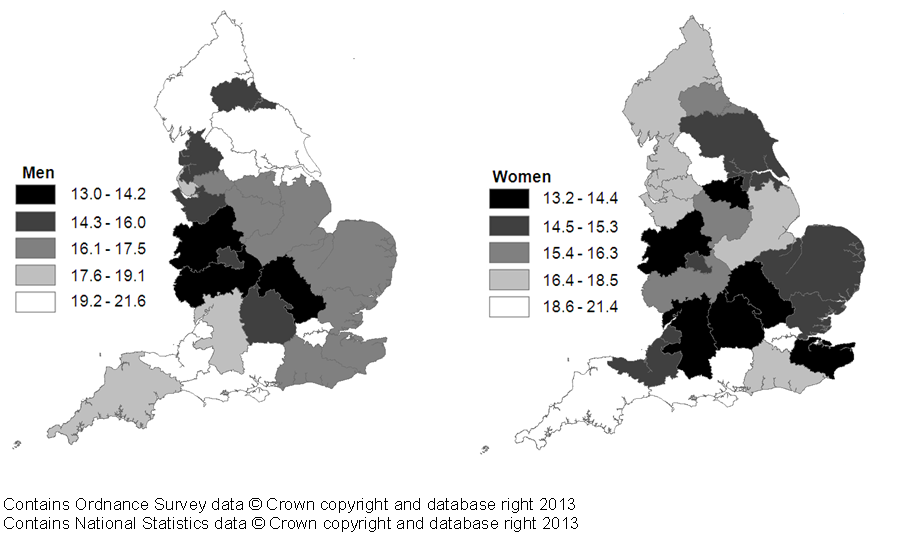
7. Colon cancer
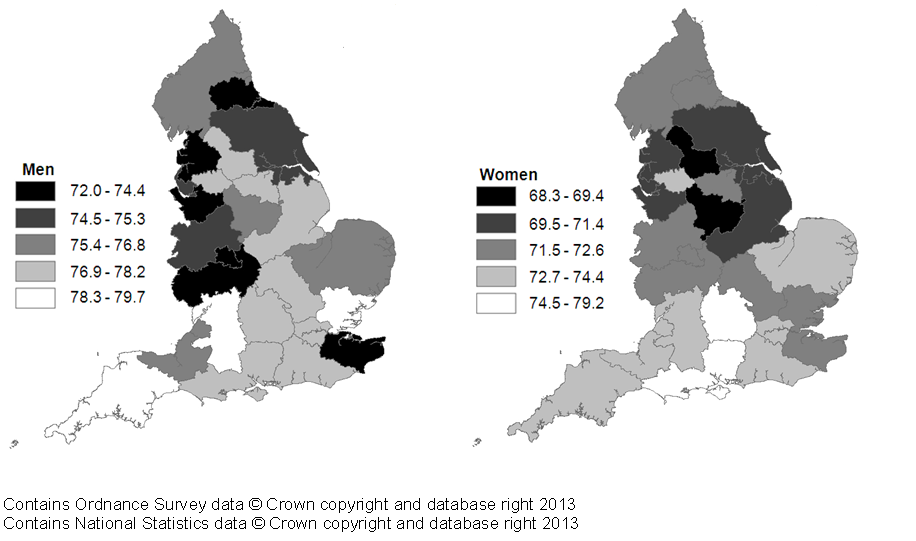
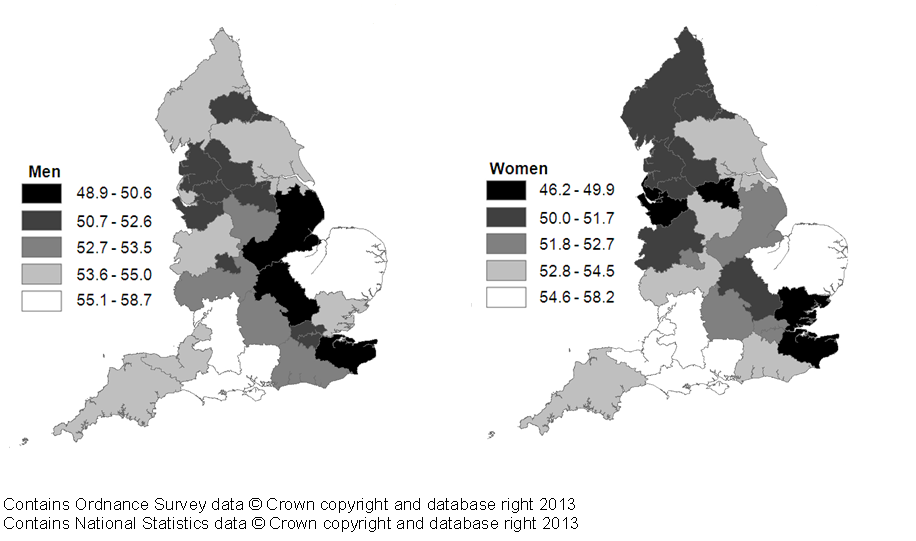
One-year age-standardised net survival ranged between 72.0% and 79.7% in men and between 68.3% and 79.2% in women. (Tables and Figures C1 and C2). Most NHS England Area Teams saw statistically significant improvements in survival for those diagnosed in 2011 compared to those diagnosed in 1996, these improvements ranged from 8% to 18% for men and 4.4% to 18.5% for women. Five-year age-standardised net survival ranged between 48.9% and 58.7% in men (Tables and Figures C1 and C2 (357.5 Kb Excel sheet)), and between 46.2% and 58.2% in women. Many of the NHS England Area Teams also saw statistically significant improvements in five-year survival, ranging from 1.4% to 16.6% for men and 4.1% to 15.8% for women (Tables and Figures C3 and C4 (357.5 Kb Excel sheet)).
Figure 5A: One-year age-standardised net survival (%) from colon cancer for patients diagnosed 2011, by NHS England area teams and sex
Source: Office for National Statistics
Download this image Figure 5A: One-year age-standardised net survival (%) from colon cancer for patients diagnosed 2011, by NHS England area teams and sex
.png (104.0 kB)
Figure 5B: Five-year age-standardised net survival (%) from colon cancer for patients diagnosed 2006, by NHS England area teams and sex
Source: Office for National Statistics
Download this image Figure 5B: Five-year age-standardised net survival (%) from colon cancer for patients diagnosed 2006, by NHS England area teams and sex
.png (102.0 kB)
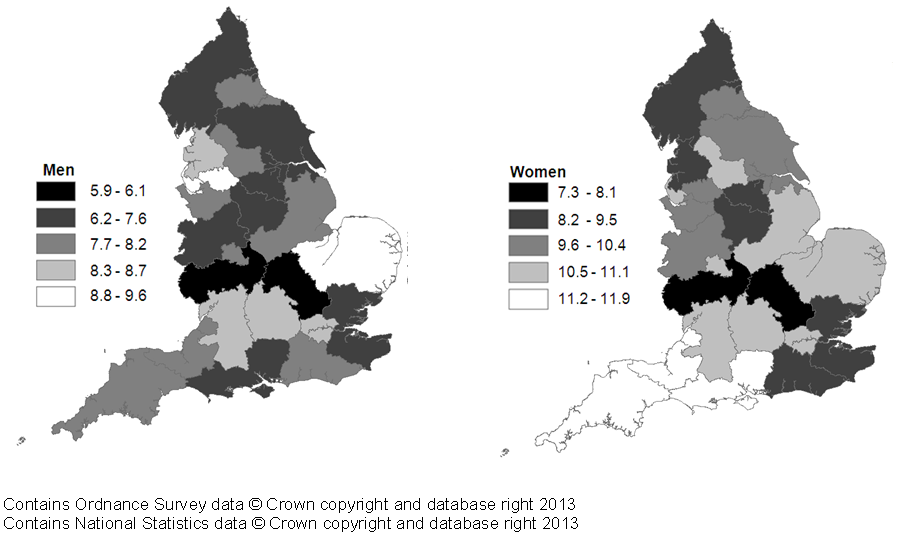
8. Lung cancer
One-year age-standardised net survival improved between 1996 and 2011, however survival remained low, ranging between 28.3% and 34.6% in men and between 29.6% and 40.7% in women (Tables and Figures D1 and D2 (341.5 Kb Excel sheet)). Five-year age-standardised net survival doubled in three NHS England Area Teams for men in the North of England Region: Greater Manchester, Lancashire, and South Yorkshire and Bassetlaw, while survival for women doubled in five NHS England Area Teams: Lancashire; South Yorkshire and Bassetlaw; Bristol, North Somerset, Somerset and South Gloucestershire; Kent and Medway; and Thames Valley. Despite these improvements five-year age-standardised net survival remained under 20% for both men and women. Five-year age-standardised net survival varied between NHS England Area Teams ranging from 5.9% to 9.6% in men and 7.3% to 16.6% in women (Tables and Figures D3 and D4 (341.5 Kb Excel sheet)).
Figure 6A: One-year age-standardised net survival (%) from lung cancer for patients diagnosed 2011, by NHS England area teams and sex

Source: Office for National Statistics
Download this image Figure 6A: One-year age-standardised net survival (%) from lung cancer for patients diagnosed 2011, by NHS England area teams and sex
.png (104.7 kB)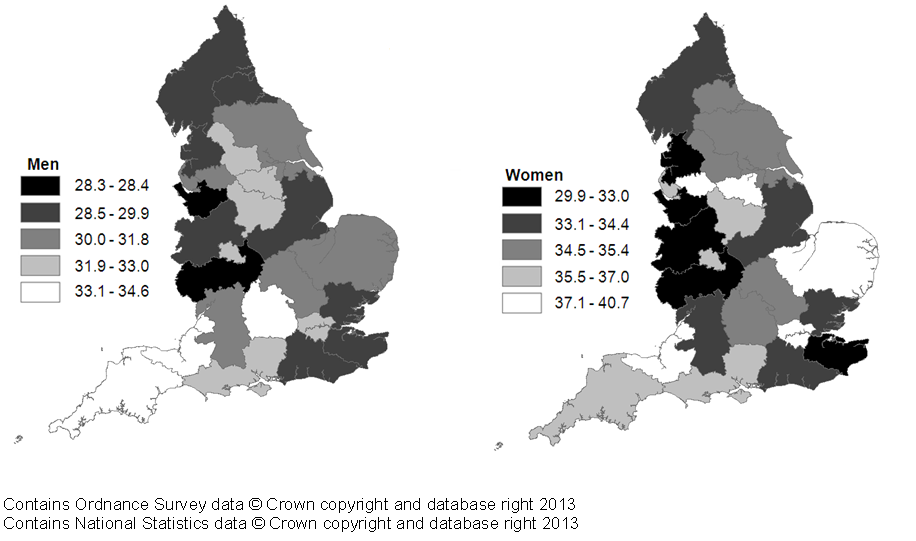
Figure 6B: Five-year age-standardised net survival (%) from lung cancer for patients diagnosed 2006, by NHS England area teams and sex
Source: Office for National Statistics
Download this image Figure 6B: Five-year age-standardised net survival (%) from lung cancer for patients diagnosed 2006, by NHS England area teams and sex
.png (100.5 kB)
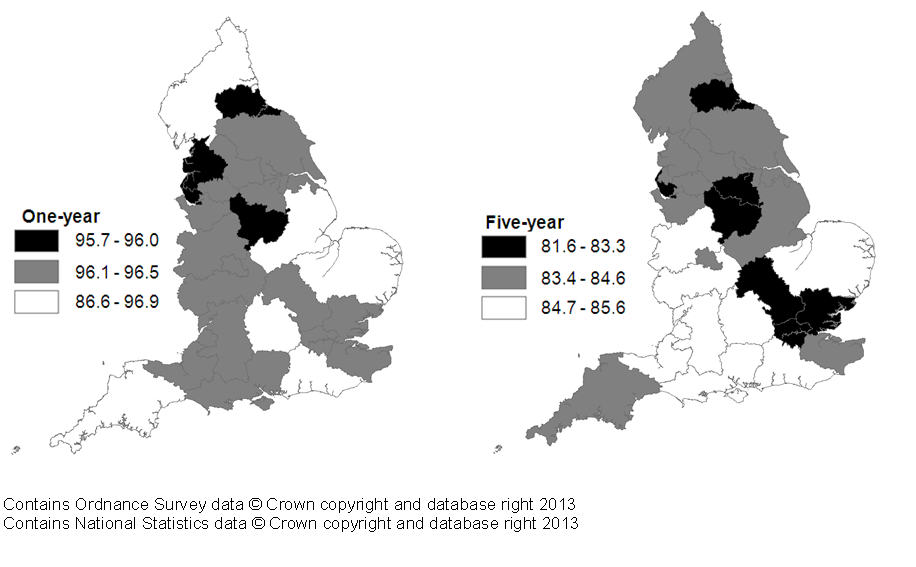
9. Breast cancer (women)
One-year age-standardised net survival was very high and above 95%, with a narrow range of only 1.3% between the highest (96.9%) and lowest NHS England Area Team (95.7%). Statistically significant improvements in one-year age-standardised net survival for patients diagnosed in 2011 compared with 1996 ranged from 2.8% to 8.9% (Table and Figure E1 (235 Kb Excel sheet)). Five-year age-standardised net survival was above 80% with a range of 4% between the highest (85.6%) and lowest NHS England Area Team (81.6%). Statistically significant improvements in five-year age- standardised net survival for women diagnosed in 1996 compared to women diagnosed in 2006 ranged from 5.7% to 14.5% (Table and Figure E2 (235 Kb Excel sheet)).
Figure 7: One-year and five-year age-standardised net survival (%) from breast cancer for patients diagnosed 2011 and 2006 respectively, by NHS England area teams
Source: Office for National Statistics
Download this image Figure 7: One-year and five-year age-standardised net survival (%) from breast cancer for patients diagnosed 2011 and 2006 respectively, by NHS England area teams
.png (96.3 kB)
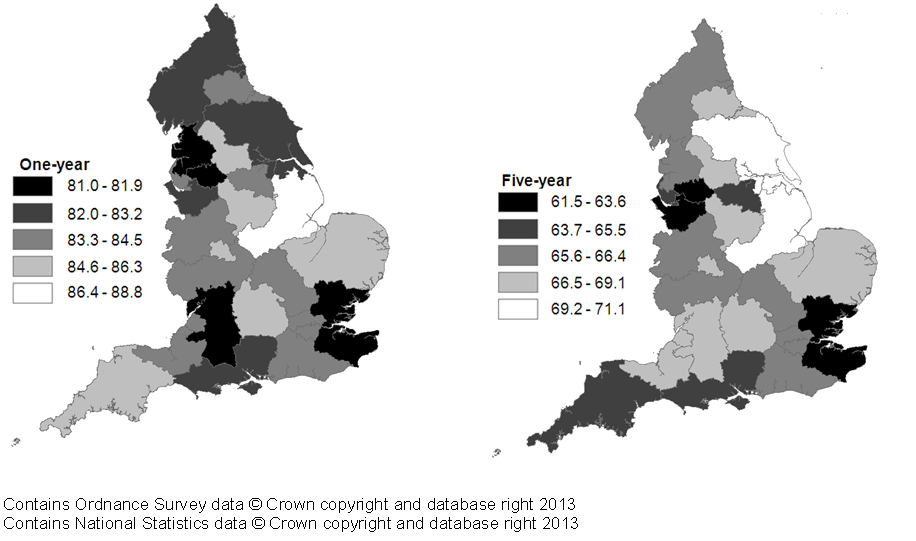
10. Cervival cancer
One-year age-standardised net survival was above 80% across all NHS Area Teams ranging from 81.0% in the lowest to 88.8% in the highest. A number of NHS England Area Teams saw statistically significant improvements in one-year age-standardised net survival for those diagnosed in 2011 compared with those diagnosed in 1996, with these improvements ranging from 4.2% to 12.8% (Table and Figure F1 (227.5 Kb Excel sheet)). Five-year age-standardised net survival ranged between 61.5% and 71.1%. Statistically significant improvements in five-year age-standardised net survival were seen in nine NHS England Area Teams, with improvements ranging from 4.5% to 13.5% (Table and Figure F2 (227.5 Kb Excel sheet)).
Figure 8: One-year and five-year age-standardised net survival (%) from cervical cancer for patients diagnosed 2011 and 2006 respectively, by NHS England area teams
Source: Office for National Statistics
Download this image Figure 8: One-year and five-year age-standardised net survival (%) from cervical cancer for patients diagnosed 2011 and 2006 respectively, by NHS England area teams
.png (108.2 kB)
11. Users and uses
Key users of cancer survival estimates include the Department of Health, academics and researchers, cancer charities, cancer registries, other government organisations, researchers within ONS, the media, and the general public. The Department of Health uses cancer survival figures to brief parliamentary ministers, and as part of the evidence base to inform cancer policy and programmes, for example in drives to improve survival rates. Cancer survival estimates will also be used to measure progress against NHS Outcomes Framework indicators. Academics and researchers use the figures to inform their own research. Similarly cancer registries and other government organisations use the figures to carry out individual and collaborative projects to apply subject knowledge to practice. Charities use the data so they can provide reliable and accessible information about cancer to a wide range of groups, including patients and health professionals via health awareness campaigns and cancer information leaflets/web pages. Researchers within ONS use the data to support further research and to publish alongside other National Statistics.
Back to table of contents12. Policy context
In ‘Improving Outcomes: A Strategy for Cancer’ (January 2011), the Department of Health stated that although improvements have been made in the quality of cancer services in England, a significant gap remains in survival compared with the European average. Survival estimates for cervical, colorectal and breast cancer are some of the lowest among Member States of the Organisation for Economic Co-operation and Development (OECD) (figures for cancer survival in OECD countries are available from the OECD website). The strategy document sets out how the Department of Health aims to improve outcomes for all cancer patients and improve cancer survival, with the aim of saving an additional 5,000 lives every year by 2014/15.
Outcomes strategies set out how the NHS, public health and social care services will contribute to the ambitions for progress agreed with the Secretary of State in each of the high-level outcomes frameworks. The indicator set for the NHS Outcomes Framework 2013 to 2014 – focus on measuring health outcomes include one- and five-year cancer survival indicators for all cancers combined, and for colorectal, breast and lung cancers combined.
Back to table of contents14. Acknowledgements
The National Cancer Registry at the Office for National Statistics and the London School of Hygiene & Tropical Medicine wish to acknowledge the work of the regional cancer registries in England, which provided the raw data for these analyses.
Back to table of contents