1. Main points
In 2013 there were 18.2 million families in the UK. Of these, 12.3 million consisted of a married couple with or without children
The number of opposite sex cohabiting couple families has increased significantly, from 2.2 million in 2003 to 2.9 million in 2013. The number of dependent children living in opposite sex cohabiting couple families rose from 1.4 million to 1.9 million over the same period
There were nearly 1.9 million lone parents with dependent children in the UK in 2013, a figure which has grown steadily but not significantly from 1.8 million in 2003
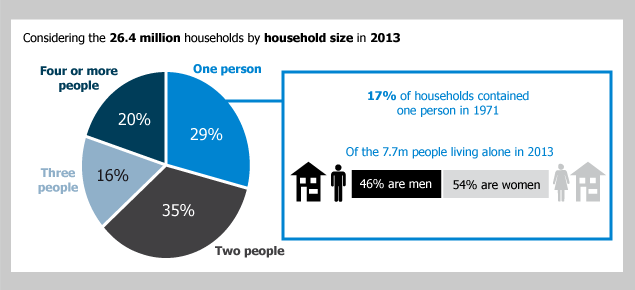
There were 26.4 million households in the UK in 2013. Of these, 29% consisted of only one person and 20% consisted of four or more people
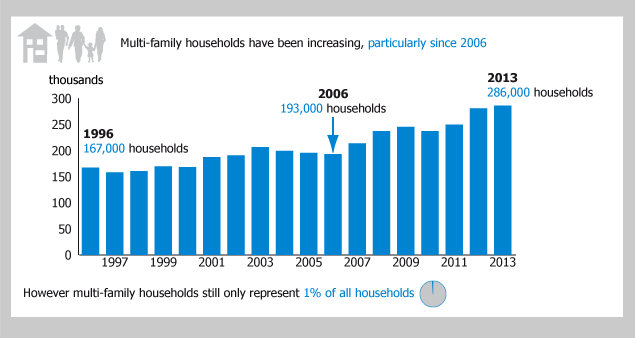
The fastest growing household type was households containing two or more families, increasing by 39% from 206,000 households in 2003 to 286,000 households in 2013. However multi-family households still only represent 1% of all households
2. Introduction
This bulletin presents annual statistics on the number of families by type, people in families by family type and children in families by type. A family is a married, civil partnered or cohabiting couple with or without children, or a lone parent with at least one child. Children may be dependent or non-dependent. Types of family include married couple families, cohabiting couple families and lone parent families.
The bulletin also presents statistics on the number of households by type, household size and people living alone for 1996 to 2013. Only the statistics for 2013 are published for the first time today. 1996 is the earliest year for which these data are available on a consistent basis.
Minor annual revisions due to survey reweighting, which are usually undertaken each year, have not been made to previously published estimates this year.
The Labour Force Survey, a large household survey of people in the UK, is used to provide estimates about UK families and households presented in this bulletin. The statistics are based on responses to the survey in the April to June quarter each year. Because the estimates are based on a survey, all estimates produced are subject to sampling variability. The majority of estimates are precise but for some smaller groups, such as civil partner couple families and same sex cohabiting couple families, the estimates are considered less precise and should be treated with more caution.
The statistics are used by those who want to improve their understanding of the UK’s families and households including:
- Policy makers
- MPs
- Journalists
- Charities
- Businesses
- Students
- Researchers and academics
- Members of the general public.
Further information about people who use statistics on families and households and what they use the statistics for can be found in the information note Families and households statistics: User experience (47.8 Kb Pdf).
Back to table of contents3. Families
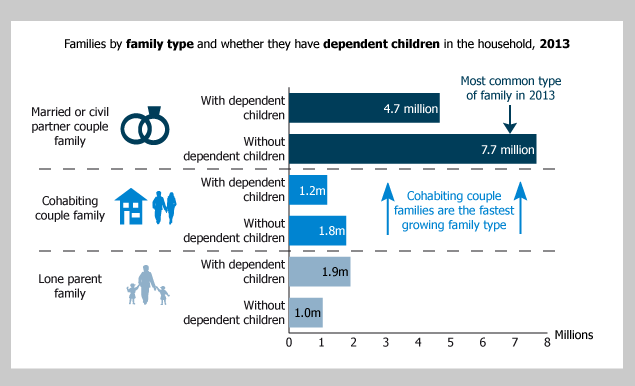
Figure 1: Families by family type, 2013
Source: Labour Force Survey - Office for National Statistics
Notes:
- Families without dependent children have only non-dependent children or no children in the household.
- Cohabiting couples include both opposite- and same-sex couples.
Download this image Figure 1: Families by family type, 2013
.png (26.0 kB) .xls (25.6 kB)Figure 1 shows that the most common family type in the UK in 2013 was a married or civil partner couple family without dependent children. There were 7.7 million such families in 2013, an increase of nearly 200,000 (3%) since 2003. This increase is driven by a rise in the number of married couples with only non-dependent (adult) children as young adults have either delayed leaving the parental home or have returned to it. Statistics published in 2012 show that there was a 20% increase in the number of 20 to 34 year olds living with their parents between 1997 and 2011.
The next most common family type was a married or civil partner couple family with dependent children, of which there were 4.7 million in 2013. This was the only family type to decrease in number since 2003 (see Table 1). However, despite an increase in cohabiting couple families and lone parent families over the last decade, married couple families are still the most common family type in the UK, both with and without dependent children.
Table 1: Families by family type in 2003 and 2013
| Thousands | ||||||
| Family type | 2003 | 2013 | ||||
| With dependent children | Without dependent children1 | Total families | With dependent children | Without dependent children1 | Total families | |
| Married couple family | 4,743 | 7,465 | 12,208 | 4,658 | 7,607 | 12,265 |
| Civil partner couple family2 | N/A | N/A | N/A | 8 | 55 | 63 |
| Opposite sex cohabiting couple family | 816 | 1,416 | 2,232 | 1,175 | 1,685 | 2,859 |
| Same sex cohabiting couple family | .. | 52 | 53 | 5 | 84 | 89 |
| Lone parent family | 1,801 | 792 | 2,593 | 1,898 | 1,037 | 2,935 |
| All families | 7,361 | 9,726 | 17,087 | 7,744 | 10,468 | 18,212 |
| Source: Labour Force Survey, Office for National Statistics | ||||||
| Notes: | ||||||
| 1. Families without dependent children have only non-dependent children or no children in the household. | ||||||
| 2. Civil partnerships were introduced in the UK in December 2005. | ||||||
| 3. .. indicates that estimates are not sufficiently reliable to be published. | ||||||
| 4. Totals may not sum due to rounding. | ||||||
Download this table Table 1: Families by family type in 2003 and 2013
.xls (26.6 kB)Table 1 shows that the total number of families in the UK has increased from 17.1 million in 2003 to 18.2 million in 2013. This is a rise of 7%, similar to the growth in the UK population during this period.
The number of married couple families increased by 56,000 between 2003 and 2013, to 12.3 million in 2013. This rise is not statistically significant. The change in opposite sex cohabiting couple families between 2003 and 2013 is statistically significant, rising from 2.2 million to 2.9 million. In 2013 there were an estimated 89,000 families consisting of a same sex cohabiting couple and 63,000 consisting of a civil partnered couple, the latter having steadily increased since the introduction of civil partnerships in the UK in December 2005.
In 2013, 38% of married couple families had dependent children living in the household compared with 41% of opposite sex cohabiting couple families. However these similar percentages mask differences between these two groups. Married women of childbearing age are more likely to give birth than cohabiting women overall1. However, married women tend to be older on average than their cohabiting counterparts so children may be older and have left home. Cohabiting couples are more likely to be younger and of childbearing age. These two competing factors of age and likelihood of childbearing mean that a very similar percentage of married couples and opposite sex cohabiting couples have dependent children living in the household.
A much lower percentage of civil partner couple families and same sex cohabiting couple families had dependent children in 2013 than married or opposite sex cohabiting couple families.
Notes for families
Back to table of contents4. Lone parents
There were nearly 1.9 million lone parents with dependent children in the UK in 2013, a figure which has grown from 1.8 million in 2003. This increase is not statistically significant. Lone parents with dependent children represented 25% of all families with dependent children in 2013, similar to 2003.
In 2013, women accounted for 91% of lone parents with dependent children and men the remaining 9%. These percentages have changed little over the previous decade. Women are more likely to take the main caring responsibilities for any children when relationships break down, and therefore become lone parents.
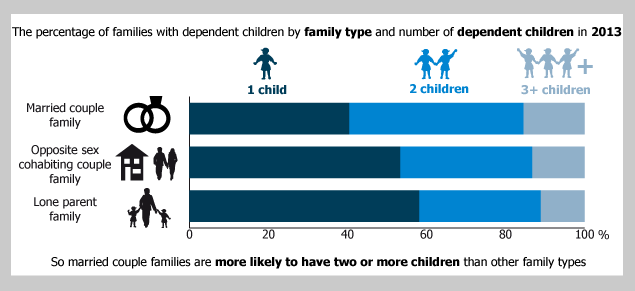
Figure 2: Families with dependent children by family type and number of dependent children, 2013
UK
Source: Labour Force Survey - Office for National Statistics
Notes:
- Less than 1 per cent of dependent children lived in civil partner or same sex cohabiting couple families in 2013. Therefore the percentages are too small to be shown.
Download this image Figure 2: Families with dependent children by family type and number of dependent children, 2013
.png (19.9 kB) .xls (25.6 kB)Figure 2 shows that 58% of lone parents with dependent children have only one child, higher than both other family types. Further, only 11% of lone parents have three or more children. Conversely, married couples with dependent children have more children on average than other family types, and only 40% have only one dependent child. These patterns are likely to reflect the stability of parental partnerships and whether there is a partner living in the household. Further, some couples may cohabit, have one child and then marry and have more children.
In 2013, 1.0 million lone parents had only non-dependent children (sometimes called adult children). This is a statistically significant increase from 792,000 in 2003. Fathers accounted for 23% of lone parents with non-dependent children, compared with 9% of lone parents with dependent children. Further information about young adults living with their parents can be found on the ONS website.
Back to table of contents5. Dependent children
Dependent children are those living with their parent(s) and either (a) aged under 16, or (b) aged 16 to 18 in full-time education, excluding children aged 16 to 18 who have a spouse, partner or child living in the household. There were 13.3 million dependent children living in families in the UK in 2013, slightly more than a decade earlier. The total number of children aged under seven has increased between 2003 and 2013, driven by a rising number of births, but the total number of children aged seven to 16 has decreased. This has lead to a slight increase overall in the total number of dependent children over this period.
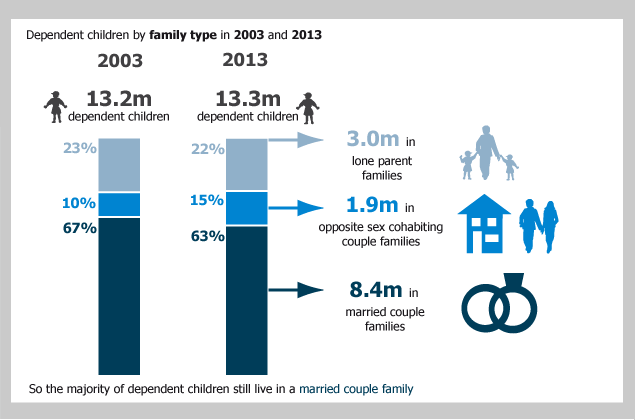
The types of families in which dependent children live have changed significantly. Figure 3 shows that the biggest difference is for dependent children living in opposite sex cohabiting couple families. In 2003 10% of dependent children lived in such families, and this rose to 15% by 2013. Over the same period, the percentage of dependent children living in a married couple family fell by four percentage points to 63% in 2013. The percentage of dependent children living in lone parent families changed little over the decade; 22% lived in lone parent families in 2013.
Figure 3: Percentage of dependent children: by family type, 2003 and 2013
Source: Labour Force Survey - Office for National Statistics
Notes:
- Less than 1 per cent of dependent children lived in civil partner or same sex cohabiting couple families in 2013. Therefore the percentages are too small to be shown.
Download this image Figure 3: Percentage of dependent children: by family type, 2003 and 2013
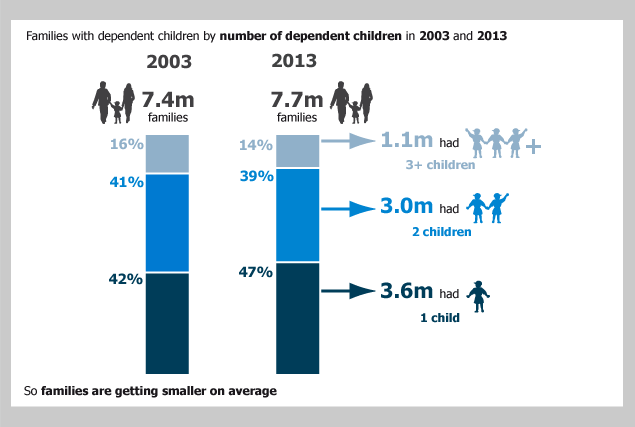
.png (25.0 kB) .xls (25.6 kB)Figure 4 shows that in 2013, 47% of families with dependent children had only one dependent child in the family at the time of the survey, a significant increase of four percentage points since 2003. In 2013, 39% of families with dependent children had two dependent children and 14% had three or more dependent children. The statistics do not necessarily indicate that the proportion of only children is increasing. This is partly because some families may have one dependent child, as well as other non-dependent (adult) children in the household. Further, women have been postponing their childbearing to older ages in recent years; this could be temporarily increasing the proportion of families who have had a first child but not yet had their second. Further information about family size can be found in the Family Size publication.
Figure 4: Percentage of families with dependent children: by number of dependent children in the family, 2003 and 2013
UK
Source: Labour Force Survey - Office for National Statistics
Notes:
- Figures may not sum exactly due to rounding.
Download this image Figure 4: Percentage of families with dependent children: by number of dependent children in the family, 2003 and 2013
.png (21.0 kB) .xls (25.1 kB)In comparison with the rest of Europe, a slightly lower proportion of households in the UK contain dependent children than the European average. One possible reason for this is that, although current UK fertility is relatively high, a larger proportion of women remain childless by the end of their childbearing years in the UK than in most other European countries1.
Notes for dependent children
Back to table of contents6. Household size
A household is defined as one person living alone, or a group of people (not necessarily related) living at the same address who share cooking facilities and share a living room, sitting room or dining area. A household can consist of more than one family, or no families in the case of a group of unrelated people.
There were 26.4 million households in the UK in 2013. Household size in 2013 is shown in Figure 5. The number of households has increased by 6% since 2003, similar to the growth in the UK population during this period. As a result average household sizes have changed little over this period: 20% of households contained four or more people in 2013, very similar to a decade earlier, while 29% of households contained one person. A different source, the General Lifestyle Survey1, which provides a longer time series, shows that 17% of households in Great Britain contained one person in 1971. Although not directly comparable, this is 12 percentage points lower than the Labour Force Survey shows for the UK in 2013.
Figure 5: Percentage of households by household size in 2013
UK
Source: Labour Force Survey - Office for National Statistics
Notes:
- Source for 1971 figure: General Lifestyle Survey, Office for National Statistics.
Download this image Figure 5: Percentage of households by household size in 2013
.png (19.0 kB) .xls (24.6 kB)The percentage of UK households which contain one person (29%) is similar to the European average2 of 30%. In 2013, the average number of people per household was 2.4, the same as the European average. According to the 2011 Census3, of the UK constituent countries, Northern Ireland had the highest average number of people per household at 2.5 and Scotland had the lowest at 2.2.
Notes for household size
- General Lifestyle Survey
- The EU Statistics on income and living conditions (EU-SILC) is the source of the European comparisons. The statistics are for 2011 and can be found on the Eurostat web page Income and Living Conditions and the countries covered are the EU27 countries.
- Source: Census 2011 table HH01UK
7. Household type
Table 2: Households by household type in 2003 and 2013
| Millions | ||||||
| Year | One person households | One family household: couple | One family household: lone parent | Two or more unrelated adults | Multi-family households | All households |
| 1996 | 6.6 | 13.9 | 2.3 | 0.7 | 0.2 | 23.7 |
| 2012 | 7.6 | 14.8 | 2.8 | 0.8 | 0.3 | 26.4 |
| Source: Labour Force Survey, Office for National Statistics | ||||||
| Notes: | ||||||
| 1. Totals may not sum due to rounding. | ||||||
Download this table Table 2: Households by household type in 2003 and 2013
.xls (54.3 kB)Table 2 shows that the most common household type in 2013 was one family consisting of a couple with or without children. There were 14.8 million such households, an increase from 14.2 million households in 2003. Despite this increase in absolute numbers, there has been a slight reduction in the proportion of all households of this type, from 57% of all households in 2003 to 56% in 2013.
The next most common household type was one person households, of which there were 7.7 million in 2013. UK households containing one lone parent family increased from 2.5 million in 2003 to 2.8 million a decade later. Although international comparisons are not straightforward due to definitional differences, the proportion of households in the UK which consist of a lone parent with dependent children is much higher than the European average1; only five countries (Belgium, Ireland, Latvia, Lithuania and Norway) have a higher proportion.
Households containing two or more families were the fastest growing household type, increasing by 39% from 206,000 households in 2003 to 286,000 households in 2013. Despite this rise, multi-family households still only represented a very small proportion (1%) of all households in 2013. Figure 6 shows that growth was observed between 1996 and 2013, with larger estimates in 2012 and 2013. Families in these households may be unrelated, or may be related in some way, for example a married couple with their son and his girlfriend.
Figure 6: Multi-family households, 1996 to 2013
UK
Source: Labour Force Survey - Office for National Statistics
Download this image Figure 6: Multi-family households, 1996 to 2013
.png (18.6 kB) .xls (25.1 kB)Notes for household type
- The EU Statistics on income and living conditions (EU-SILC) is the source of the European comparisons. The statistics are for 2011 and can be found on the Eurostat web page Income and Living Conditions and the countries covered are the EU27 countries.
8. Living alone
In 2013, 7.7 million people in UK households lived alone, of which 4.1 million were aged 16 to 64. Of those in this age group, the majority (58%) were male. One possible reason for this is that at every age a higher proportion of men than women have never married; 61% of men aged 16 to 64 living alone have never married compared with 49% of women living alone in the same age group.
For those aged 65 or over, the pattern is reversed; at this age the majority of people living alone (68%) were female. This is partly because there are more women than men in the total population aged 65 or over due to women’s higher life expectancy. There are 1.7 million widowed women aged 65 or over living alone in the UK, three times the number of men. By the age of 65 most women have been married1, and husbands are typically older than their wives. These two factors accentuate the gap in life expectancy between husbands and wives, and mean that more wives than husbands become widowed, despite the falling number of widowed women in the population.
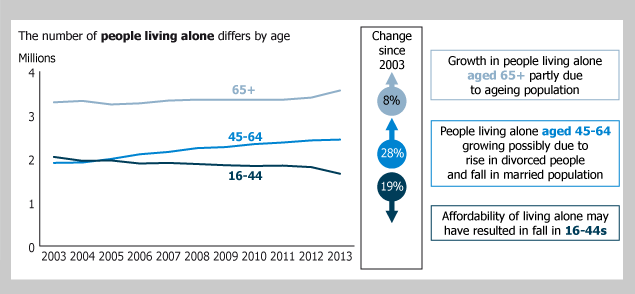
Figure 7 shows the trends in the number of people living alone by age group between 2003 and 2013. The largest change is in the 45 to 64 age group, where the number of people living alone increased by 28% between 2003 and 2013. This is partly due to the increasing population aged 45 to 64 in the UK over this period, as the 1960s baby boom generation have started to enter this age group. The increase in those living alone also coincides with a decrease in the percentage of those in this age group who are married (from 76% in 2003 to 69% in 2013), and a rise in the percentage of those aged 45 to 64 who have never married, or are divorced (from 20% in 2003 to 28% a decade later).
The number of people in the UK aged 16 to 44 increased slightly between 2003 and 2013 but the number living alone in this age group fell by 19% to 1.7 million in 2013. Previous research has shown that the proportion of those aged 20 to 34 living with their parents has increased over the past decade2. Affordability of moving out of the parental home has been cited as a possible factor in this increase. In addition, academic research3 has illustrated that there has been a shift towards sharing with others outside a family among young adults.
Figure 7: People living alone: by age group, 2003 to 2013
UK
Source: Labour Force Survey - Office for National Statistics
Download this image Figure 7: People living alone: by age group, 2003 to 2013
.png (22.6 kB) .xls (25.6 kB)Notes for living alone
- Statistics showing the proportion of men and women ever married by certain ages are available on the ONS website.
- Young adults living with parents publication
- The changing determinants of UK young adults’ living arrangements
9. Results from the 2011 Census
Analysis of families and households in England and Wales using the 2011 Census is available on the ONS website. This includes interactive maps of those living alone and of lone parent households.
Tables from the 2011 Census about families and households are available for England and Wales on the nomis website. Census results are also available for Northern Ireland and Scotland. The Census is the best source of information for families and households statistics for local authorities and smaller areas. Particularly relevant tables for England and Wales include:
QS113EW – Household composition (households) (including people living alone and couple households)
QS406EW – Household size
QS118EW – Families with dependent children (including the number of families with one, two or three or more children)
KS107EW – Lone parent households with dependent children (including sex of lone parent and whether they are in employment)
DC1107EW – Marital or civil partnership status by age group and sex
DC1601EWla – Family status by number of parents working by dependent children in family by economic activity
Similar tables for Scotland and Northern Ireland either have or will be published in due course by National Records of Scotland and the Northern Ireland Statistics and Research Agency respectively.
Back to table of contents10. Comparisons with results from the 2011 Census
At the time of the publication of these statistics, few UK statistics about families or households from the 2011 Census have been published. However, initial comparisons between the 2011 Census and the source of the estimates in this publication (the Labour Force Survey) for England and Wales indicate that the two sources provide estimates which are generally very close. The following show the percentage difference between the 2011 Labour Force Survey and Census for different estimates:
1% difference for all families
2% difference for families with non-dependent children
<0.5% difference for families with dependent children
6% difference for married couple families with dependent children
2% difference for opposite sex cohabiting couple families with dependent children
13% difference for lone parent families with dependent children
1% difference for all households
Neither source of data is wrong. As both sources are collected in different ways, the following could be possible reasons for differences in estimates between the sources:
Revisions made to population estimates after the publication of population figures from the 2011 Census have not yet been incorporated into any weighting for the Labour Force Survey. Once this reweighting has been completed in 2014, it is expected that the two sources will be more comparable. It is also expected that this will increase the Labour Force Survey estimates of women more than men1, which may explain the 13% difference for lone parent families with dependent children because most lone parents are lone mothers
The Labour Force Survey is a large survey of households. As such all estimates are subject to sampling variation because the sample selected is only one of a large number of possible samples that could have been drawn from the population. In contrast, the Census aims to count the whole population
Taking part in the Labour Force Survey is not compulsory unlike the Census. As such, the characteristics (including family and household type) of those who do take part may be different to the characteristics of those who don’t
Although the Census counts almost all the population (a response rate of 94%) some estimation and imputation is required for those who did not respond to the Census or the particular questions used. While this will only marginally affect the overall distributions it is another potential reason for difference
The Census is completed by individuals alone whereas an interviewer asks the LFS questions. That may lead to differences in understanding and interpreting the questions.
The Office for National Statistics will publish more information about the differences between both sources once more estimates about families and households for the UK are available from the 2011 Census and the Labour Force Survey has been reweighted.

