Table of contents
1. Main findings
Improved methodology has been implemented leading to revisions to the full IPHRP time series. The data presented in this statistical bulletin are presented using the new methodology
Private rental prices paid by tenants in Great Britain rose by 1.7% in the 12 months to December 2014
Private rental prices grew by 1.8% in England, 2.0% in Scotland and 0.2% in Wales in the 12 months to December 2014
Rental prices increased in all the English regions over the year to December 2014, with rental prices increasing the most in London (2.4%), followed by the South East (2.1%)
2. About this statistical bulletin
The Index of Private Housing Rental Prices (IPHRP) measures the change in price of renting residential property from private landlords. The index is published as a series of price indices covering Great Britain, its constituent countries and the English regions.
IPHRP measures the change in price tenants face when renting residential property from private landlords, thereby allowing a comparison between the prices tenants are charged in the current month as opposed to the same month in the previous year. The index does not measure the change in newly advertised rental prices only, but reflects price changes for all private rental properties.
IPHRP is released as an experimental statistic. This is a new official statistic undergoing evaluation and therefore it is recommended that caution is exercised when drawing conclusions from the published data as the index is likely to be further developed. Once the methodology is tested and assessed, and the publication meets user needs, the IPHRP will be assessed against the Code of Practice for Official Statistics to achieve National Statistic status. A complete description of the methodology and the sources used is included in the article Index of Private Housing Rental Prices - Historical Series. Further details regarding improvements to the IPHRP price collection methodology can be found in the January 2015 article.
The IPHRP is constructed using administrative data. That is, the index makes use of data that are already collected for other purposes in order to estimate rental prices. The sources of private rental prices are Valuation Office Agency (VOA), Scottish Government (SG) and Welsh Government (WG). All three organisations deploy rental officers to collect the price paid for privately rented properties. The sources of expenditure weights are Department for Communities and Local Government (DCLG), Scottish Government, Welsh Government and VOA. DCLG produces estimates of the private rental dwelling stock for England and its regions. Scottish Government and Welsh Government produce estimates of private rental dwelling stock for Scotland and Wales.
Back to table of contents3. Revisions to IPHRP
Following previous announcements regarding potential improvements to IPHRP, this latest release is being published using improved price methodology. These improvements have led to revisions to the full IPHRP time-series. A separate section of this statistical bulletin assesses the impact of these revisions and a separate reference table (165.5 Kb Excel sheet) highlighting the size of the revisions has also been published. A detailed article describing the improvements to the price methodology has been published alongside this release.
Back to table of contents4. Great Britain rental prices
The Great Britain private rental price series starts in January 2011. This is the date for which all the sources for constituting countries are available on a consistent basis. This index has seen gradual increases since January 2011 (Figure 1).
Figure 1: IPHRP indices, Great Britain
January 2011 to December 2014
Source: Office for National Statistics
Notes:
- Not seasonally adjusted.
Download this chart Figure 1: IPHRP indices, Great Britain
Image .csv .xlsBetween December 2013 and December 2014 Great Britain private rental prices grew by 1.7%. For example, a property that was rented for £500 a month in December 2013, which saw its rent increase by the Great Britain average rate would be rented for £508.50 in December 2014.
Rental prices for Great Britain excluding London grew by 1.4% in the same period (Figure 2). This difference is due to the higher inflation in rental prices experienced in London when compared to the rest of Great Britain and its large weight in the Great Britain index. The large weight that London has in the overall index reflects its high average rental prices and its large volume of private rented property.
Figure 2: IPHRP percentage change over 12 months, Great Britain
January 2012 to December 2014
Source: Office for National Statistics
Notes:
- Not seasonally adjusted.
Download this chart Figure 2: IPHRP percentage change over 12 months, Great Britain
Image .csv .xls5. Rental prices for constituent countries of Great Britain
All the countries that constitute Great Britain have experienced rises in their private rental prices since 2011 (Figure 3). Since January 2011 England rental prices have increased more than those of Scotland and Wales.
Figure 3: IPHRP indices for Great Britain and its constituent countries
January 2011 to December 2014
Source: Office for National Statistics
Notes:
- Not seasonally adjusted.
Download this chart Figure 3: IPHRP indices for Great Britain and its constituent countries
Image .csv .xlsThe annual rate of change in the IPHRP for Wales continues to be below that of England and the Great Britain average (Figure 4). The annual growth rate in Scotland remains higher than both England and Wales, having surpassed the growth levels in England in December 2013.
Figure 4: IPHRP percentage change over 12 months, Great Britain and its constituent countries
January 2012 to December 2014
Source: Office for National Statistics
Notes:
- Not seasonally adjusted.
Download this chart Figure 4: IPHRP percentage change over 12 months, Great Britain and its constituent countries
Image .csv .xlsBetween December 2013 and December 2014, rental prices grew by 1.8% in England, 2.0% in Scotland and 0.2% in Wales (Figure 5).
Figure 5: IPHRP percentage change over the 12 months to December 2014, Great Britain and its constituent countries
Source: Office for National Statistics
Notes:
- Not seasonally adjusted.
Download this chart Figure 5: IPHRP percentage change over the 12 months to December 2014, Great Britain and its constituent countries
Image .csv .xls6. Rental prices in England and its regions
The IPHRP series for England starts in 2005. Private rental prices in England show three distinct periods: rental price increases from January 2006 until November 2009, rental price decreases from December 2009 to October 2010, and increasing rental prices from November 2010 onwards (Figure 6). Of these three periods, 2008 showed the largest rental price increases. When London is excluded, England shows a similar pattern but with slower rental price increases from around January 2011.
Figure 6: IPHRP indices, England
January 2005 to December 2014
Source: Office for National Statistics
Notes:
- Not seasonally adjusted.
Download this chart Figure 6: IPHRP indices, England
Image .csv .xlsFigure 7 shows the historical 12 month percentage growth rate in the rental prices of each of the English regions.
Figure 7: IPHRP percentage change over 12 months by English region
January 2006 to December 2014

Source: Office for National Statistics
Notes:
- The dotted grey line shows the average England 12 month percentage change.
- Not seasonally adjusted.
Download this image Figure 7: IPHRP percentage change over 12 months by English region
.png (29.6 kB) .xls (53.2 kB)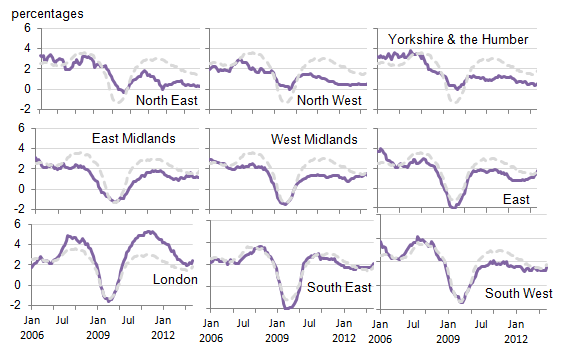
Since the beginning of 2012 English rental prices have shown annual increases ranging between 1.4% and 3.0% year-on-year, with December 2014 rental prices being 1.8% higher than December 2013 rental prices (Figure 8). Excluding London, England showed an increase of 1.3% for the same period.
Figure 8: IPHRP percentage change over 12 months, England
January 2006 to December 2014
Source: Office for National Statistics
Notes:
- Not seasonally adjusted.
Download this chart Figure 8: IPHRP percentage change over 12 months, England
Image .csv .xlsIn the 12 months to December 2014, private rental prices increased in each of the nine English regions (Figure 9). The largest annual rental price increases were in London (2.4%) followed by the South East (2.1) and the East (1.8%). Rental price increases have been stronger in London than the rest of England since about January 2011.
Figure 9: IPHRP percentage change over the twelve months to December 2014 by English region
December 2014
Source: Office for National Statistics
Notes:
- Not seasonally adjusted.
Download this chart Figure 9: IPHRP percentage change over the twelve months to December 2014 by English region
Image .csv .xls7. Impact of revising IPHRP
The Index of Private Housing Rental Prices (IPHRP) is an experimental statistic that measures the change in price of renting residential property from private landlords and is published as a series of price indices covering Great Britain, its constituent countries and English regions. The index was first published in June 2013 in response to recommendations made in the 2012 National Statistician's review of housing market statistics.
The production and publication of IPHRP built on the development work to include owner occupiers’ housing (OOH) costs in CPIH, the measure of consumer price inflation (71.3 Kb Pdf) that includes housing costs, utilising the same source of rental prices from VOA and both the Welsh and Scottish Governments.
A decision was made to initially publish IPHRP as an experimental statistic whilst further evaluation and development of the methodology underpinning the index took place. Following the first year of publication a user feedback exercise was carried out to identify how IPHRP was being received by those using private rental statistics. A summary of the feedback was published in April 2014 and highlighted a number of areas of IPHRP for investigation. The most pressing of these issues was the perceived low level of private rental inflation shown by IPHRP. Whilst part of this perception could be attributed to a misunderstanding of what IPHRP was intended to measure (IPHRP is a measure of the stock of private rented properties, which covers both ongoing and new rental prices where-as some users were comparing IPHRP to just flow based measures, that is, price changes for newly advertised prices where inflation is likely to be higher), ONS acted on this feedback to review the methodology to ensure the price data was fit for purpose. As detailed in the article accompanying this release, this analysis identified inefficiencies with the methodology used to produce the component price indices feeding into IPHRP and a number of steps have now been taken to improve the methodology and quality assure the results produced using the improved methods.
The IPHRP user feedback exercise also identified that users wanted improvements to the frequency of publication of IPHRP, better methodological clarity, and, if possible more supplementary data (and data published at a lower geographical level) published on the private rental market. Since the user feedback exercise, ONS has prioritised improvements to the price index methodology, resulting in the improvements presented in this release. It is hoped that the accompanying article will also go some way to providing clarity regarding the price methodology used in the production of IPHRP although a separate IPHRP ‘methodology explained’ article will be published by October 2015 which will focus specifically on better explaining the IPHRP methodology. Following this publication ONS will begin to consider further the other points raised by users, namely improvement in frequency of IPHRP publication (i.e. publishing IPHRP monthly), expanding coverage of IPHRP to the UK and consideration of what supplementary analysis can be published alongside IPHRP.
The same data sources and price methodology are used in the production of IPHRP and OOH indices, therefore the same limitations with OOH indices (as documented in the accompanying article) were also present in the IPHRP indices. These limitations with the price methodology meant IPHRP resulted in a downward bias in the price series. In simple terms this meant IPHRP was underestimating inflation in the private rental market.
The methodological improvements are detailed in full in the accompanying article and have been implemented in the production of IPHRP. This has led to revisions across the whole IPHRP time series (the IPHRP reference table has been updated with revisions tables (165.5 Kb Excel sheet)). Briefly summarised, these improvements to the price index methodology include:
improvements to the process for determining comparable replacements, leading to more viable matches when replacing properties in the sample used to calculate price change.
bringing the process for replacing properties for which there is no comparable replacement into line with that used for other goods and services in consumer price statistics.
reducing the sample of properties used at the start of the year, to increase the pool of properties from which comparable replacements can be selected.
reassessing the length of time for which a rent price can be considered valid before a replacement property is found. This period has been reduced from 18 months (as used in the initial publication of IPHRP) to 14 months.
Impact of revised methodology
The implementation of these improvements has resulted in a more accurate and responsive IPHRP. The price index has been recalculated using the new methodology and the revised time series published in this statistical bulletin. The accompanying reference table (165.5 Kb Excel sheet) includes further analysis of the revisions to each series published. The new IPHRP results show that, at the aggregated Great Britain level, IPHRP was underestimating inflation by an average of 0.9 percentage points (pp). Using the old methodology, the average annual growth rate across the Great Britain time-series (which starts in January 2011) was 1.2%, this has now increased to 2.1% (Figure 10).
Figure 10: Impact of revised IPHRP methodology on annual growth rate, Great Britain
January 2012 to December 2014

Source: Office for National Statistics
Download this image Figure 10: Impact of revised IPHRP methodology on annual growth rate, Great Britain
.png (19.1 kB) .xls (31.7 kB)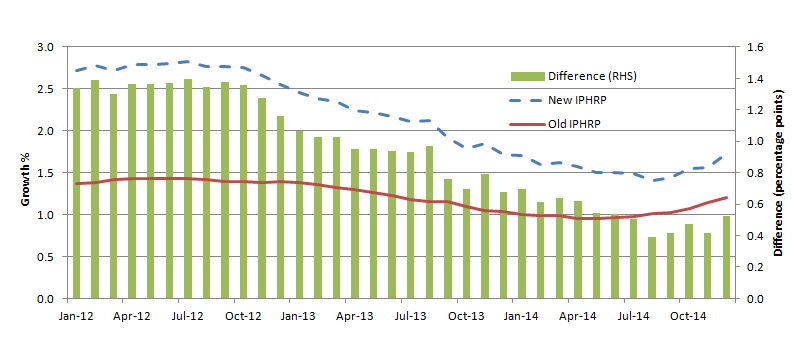
Comparing the latest published IPHRP period (December 2014) with the start of the Great Britain time-series in January 2011, the new IPHRP methodology shows rental prices have increased by almost 9% during this period. Under the old IPHRP methodology, this shows prices increasing by just under 5% over the same period (Figure 11).
Figure 11: Impact of revised IPHRP methodology on index value history, Great Britain
January 2011 to December 2014
Source: Office for National Statistics
Notes:
- Not seasonally adjusted.
Download this chart Figure 11: Impact of revised IPHRP methodology on index value history, Great Britain
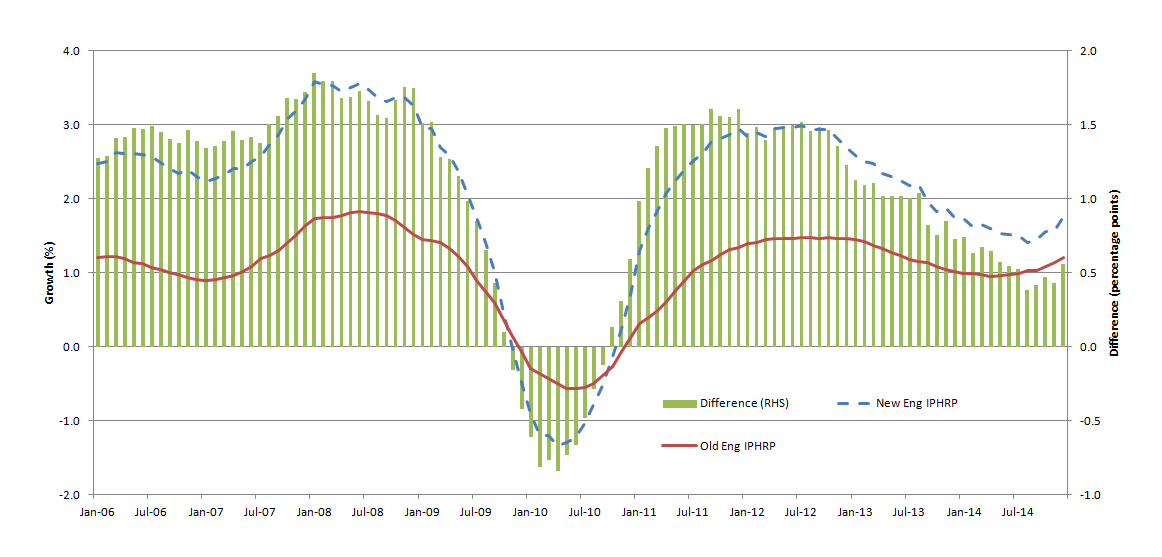
Image .csv .xlsA similar picture can be found at the country level. The impact of introducing improved methodology on the annual growth rate in the England series (which begins in January 2005) shows an average upward revision of 1.0pp (Figure 12).
Figure 12: Impact of revised IPHRP methodology on annual growth rate, England
January 2006 to December 2014
Source: Office for National Statistics
Notes:
- Not seasonally adjusted.
Download this image Figure 12: Impact of revised IPHRP methodology on annual growth rate, England
.png (40.6 kB) .xls (40.4 kB)
The impact of the improved methodology is smaller for the Scotland series (Figure 13). The new data shows an average upward revision of 0.4pp in the Scotland series (which begins in January 2011).
Figure 13: Impact of revised IPHRP methodology on annual growth rate, Scotland
January 2012 to December 2014

Source: Office for National Statistics
Notes:
- Not seasonally adjusted.
Download this image Figure 13: Impact of revised IPHRP methodology on annual growth rate, Scotland
.png (39.2 kB) .xls (32.3 kB)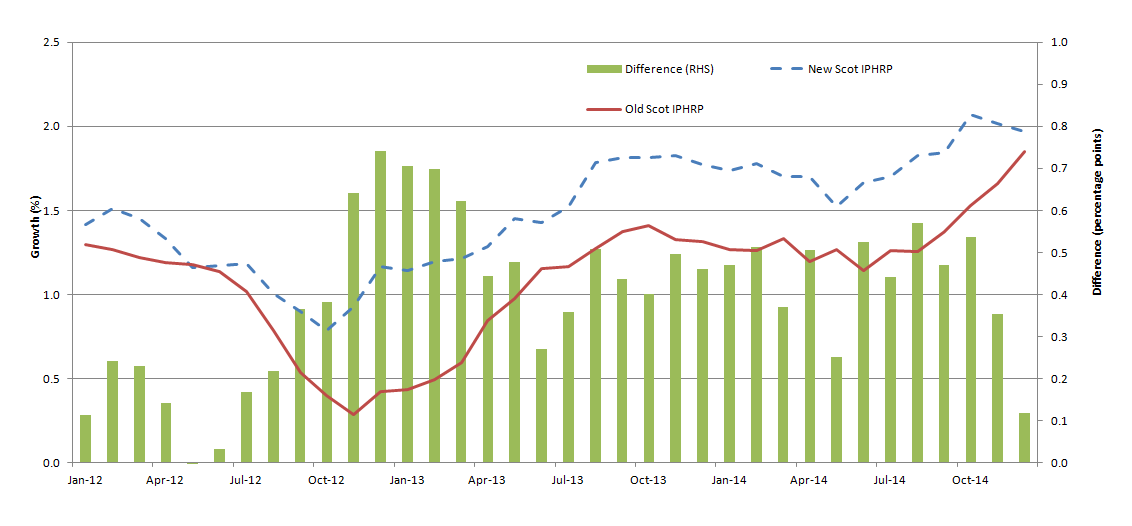
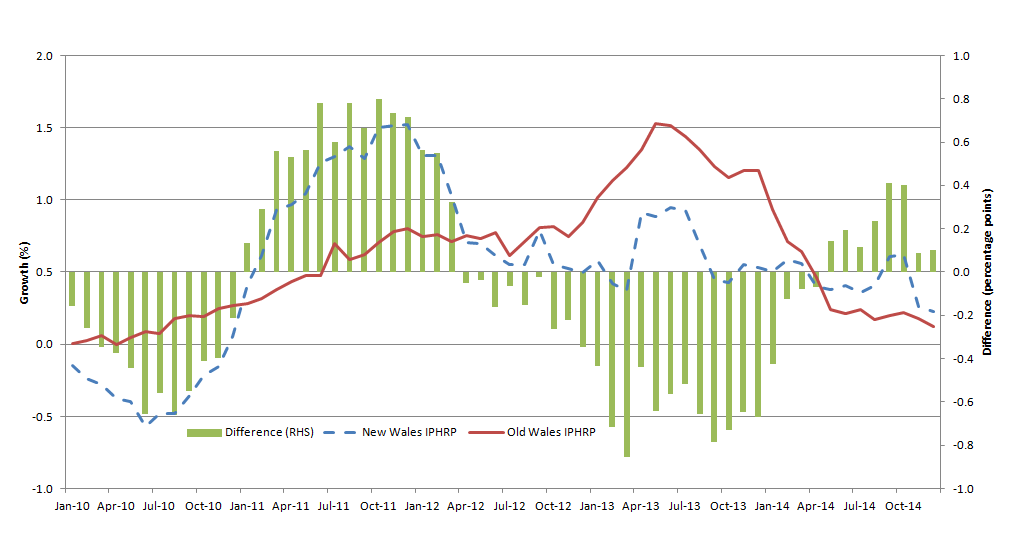
For Wales (Figure 14), the improvements result in an average downward revision of 0.1pp over the history of the series (which begins in January 2009).
Figure 14: Impact of revised IPHRP methodology on annual growth rate, Wales
January 2010 to December 2014
Source: Office for National Statistics
Notes:
- Not seasonally adjusted.
Download this image Figure 14: Impact of revised IPHRP methodology on annual growth rate, Wales
.png (38.9 kB) .xls (34.8 kB)
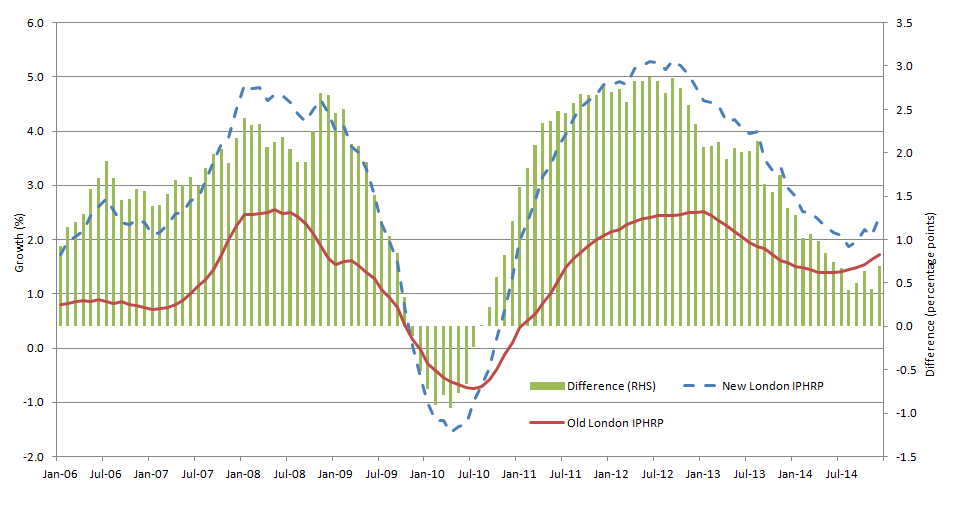
At the regional level, the improved methodology has led to an average upward revision to annual growth in all regional series ranging from an average upward revision of 0.5pp in the East to an average revision of 1.6pp in London (all regional series begin in January 2005). Full time series data for each region and an assessment of the revisions can be found in the latest IPHRP reference table (169.5 Kb Excel sheet) and IPHRP revisions reference table (165.5 Kb Excel sheet) . Focusing on London, the time-series is now more reactive to changes in the market (Figure 15).
Figure 15: Impact of revised IPHRP methodology on annual growth rate, London
January 2006 to December 2014
Source: Office for National Statistics
Notes:
- Not seasonally adjusted.
Download this image Figure 15: Impact of revised IPHRP methodology on annual growth rate, London
.png (40.9 kB) .xls (40.4 kB)
8. Private rental market statistics - user event
Following improvements made by ONS to the measurement of private rental price indices, a user event has been arranged to provide users of private rental statistics the opportunity to discuss these improvements as well as discussing the private rental sector more generally. The event will take place on Friday 20 February 2014 in London. Further details regarding the venue, timings, content and how to register for a place can be found on the ONS website.
Back to table of contents9. How are we doing?
The Office for National Statistics would welcome your views on the data presented in this statistical bulletin. Please contact the House Price Index team using the email address below to discuss any aspect of the data, including your views on how ONS can improve the data.
Back to table of contents