Table of contents
- Main points
- About this release
- Interpreting these statistics
- What's new?
- Current price productivity
- Constant price productivity
- Comparisons of productivity net of capital consumption (NOT NATIONAL STATISTICS)
- Comparisons with other countries (NOT NATIONAL STATISTICS)
- Revisions
- Background notes
- Methodology
1. Main points
Output per hour in the UK was 17 percentage points below the average for the rest of the major G7 advanced economies in 2013, the widest productivity gap since 1992. On an output per worker basis, UK productivity was 19 percentage points below the average for the rest for the G7 in 2013
Across the G7 as a whole, productivity as measured by output per hour and output per worker grew by around 1% in 2013 as the global economic recovery gathered momentum. In the UK, output per worker also grew in 2013, but output per hour fell
For the first time this release includes comparisons of productivity across the G7 after taking account of depreciation of fixed capital such as offices, factories, plant and equipment. Generally this approach reduces productivity differentials between the UK and the rest of the G7, although productivity in the US, Germany and France remains considerably above that of the UK on this basis
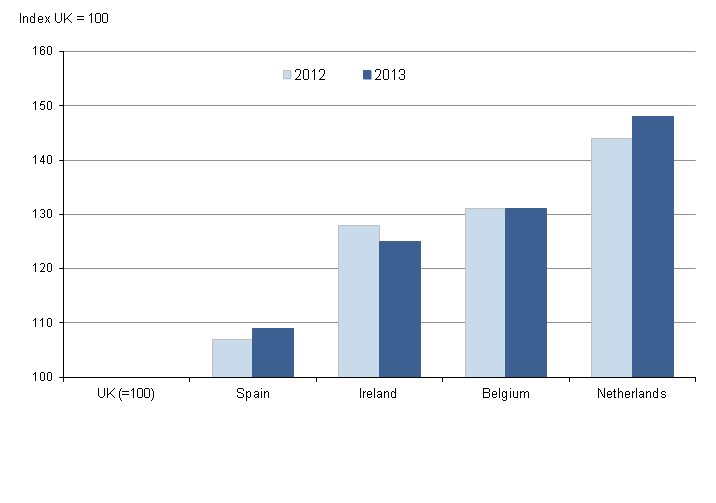
This release also includes comparisons with some of the UK's major trading partners outside the G7. In 2013, UK output per hour was 9 percentage points lower than Spain and considerably lower than productivity in Ireland, Belgium and the Netherlands
2. About this release
This bulletin contains annual estimates of labour productivity for the G7 developed countries (Canada, France, Germany, Italy, Japan, UK and USA) up to 2013. Labour productivity measures the amount of economic output that is produced by a unit of labour input, and is a key measure of economic performance.
Output is measured by gross domestic product (GDP) (with some experimental estimates in terms of net domestic product - NDP - as described further below). Labour input is measured in two ways – by total hours worked and by numbers of workers in employment. These two measures of labour input can yield different results, reflecting differences in working patterns across countries and compositional movements over time, such as a shift towards part-time working.
Comparability across countries is achieved by using estimates of GDP and labour inputs from a common source (the Statistics Directorate of the OECD) as far as possible, and by converting local currency based measures of GDP using purchasing power parity (PPP) exchange rates. PPP exchange rates (usually referred to simply as PPPs) attempt to equalise the cost of a representative basket of goods and services in countries with different national currencies. An ONS article explaining the uses and limitations of PPPs (246.1 Kb Pdf) is available on our website.
The estimates in this release update those published on 17 October 2014. This release cycle reflects the publication and revision cycles of the component data series.
Back to table of contents3. Interpreting these statistics
The labour productivity measures in this bulletin are presented in terms of current prices, suitable for cross-country comparison of levels of productivity for a single year, and constant prices, suitable for analysis of productivity performance over a number of years. The current price estimates in Tables 1, 2, 5 and 6 should be read horizontally, while the constant price estimates in Tables 3, 4, 7 and 8 should be read vertically.
Current price productivity estimates are indexed spatially to UK=100 for each year and show each country’s productivity relative to that of the UK in that year. Since productivity is a key determinant of living standards, these estimates also provide an indication of living standards relative to the UK.
In interpreting these estimates users should bear in mind that PPPs provide only an approximate conversion from national currencies and may not fully reflect national differences in the composition of a representative basket of goods and services. Additionally, care should be taken in interpreting movements in current price productivity estimates over time. For example, an increase in UK productivity relative to another country could be due to UK productivity growing faster, or falling less, or due to changes in relative prices in the two countries, or some combination of these movements.
Constant price productivity estimates are indexed to a particular year. For each single country, these estimates are almost identical to national labour productivity series (minor differences from national sources are described in the Background Notes to this bulletin). The index year is set at 2007 in order to focus on movements in labour productivity over the economic downturn.
Constant price productivity estimates show the evolution of productivity for each country and for the G7 (and G7 excluding the UK) aggregates, but should not be used to compare productivity across countries at a point in time. Productivity growth can be decomposed into growth of output minus the growth of labour input, and these components can move in different directions within and across countries. This should be borne in mind in interpreting the constant price productivity estimates in this release.
More information on methodology and interpretation is available in the Background Notes to this bulletin. Additionally, the Quality and Methodology Information paper (123.8 Kb Pdf) for this release provides information on the quality of the estimates in this release, as well as providing a summary of methods used in compiling the estimates.
Back to table of contents4. What's new?
For the first time this release includes estimates of current price NDP per hour worked for the G7 countries, indexed as in the main estimates to UK = 100. As explained further below, NDP can be seen as a measure of economic output which leaves productive capacity unchanged and is therefore a more sustainable measure than GDP. On the other hand, measures of NDP are likely to be less consistent across countries than measures of GDP. At this stage we are not publishing estimates based on constant price NDP, partly because such estimates are likely to add little to the growth rates of GDP per hour and per worker, and partly because consistency issues are larger still. As always, ONS welcomes feedback from users on these new estimates.
This release also includes productivity comparisons between the UK and a group of its main trading partners outside the G7 (Belgium, Ireland, the Netherlands and Spain). Productivity comparisons with these countries were last published in February 2014. Estimates for these countries have been updated to 2013 and earlier estimates have been revised, principally to reflect the adoption of the ESA 2010 national accounting standards. Together with the rest of the G7, these countries account for over half of the UK’s exports and imports.
Back to table of contents5. Current price productivity
Current price productivity estimates allow for comparison of how much economic output, measured in common currency terms, is produced by each worker and hour worked across countries in a particular year, relative to the UK=100. Further information is available in Tables 1 and 2 in the reference table (219 Kb Excel sheet) component of this release and at the back of the PDF version of this statistical bulletin.
GDP per hour worked (Table 1)
On this basis, UK productivity in 2013 was:
above that of Japan by 15 percentage points
roughly equal to that of Canada
lower than that of Italy by 9 percentage points
lower than that of France, Germany and the US by 27-31 percentage points
lower than that of the rest of the G7 by 17 percentage points
Figure 1: GDP per hour worked, G7 countries

Source: Office for National Statistics
Download this image Figure 1: GDP per hour worked, G7 countries
.png (13.8 kB) .xls (74.2 kB)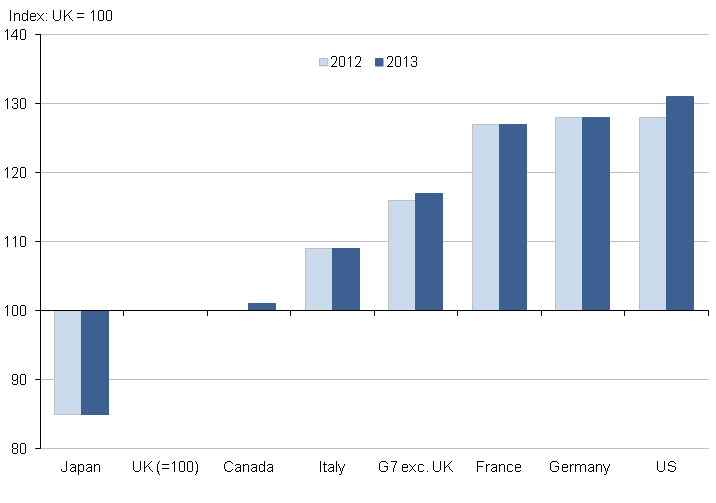
Comparing 2013 to 2012, the UK productivity shortfalls relative to Canada and the US increased, while the differentials between the UK and each of the remaining G7 countries was unchanged. In 2013 the productivity shortfall relative to the US was the widest since 1991, and 17 percentage points wider than in 2006.
GDP per worker (Table 2)
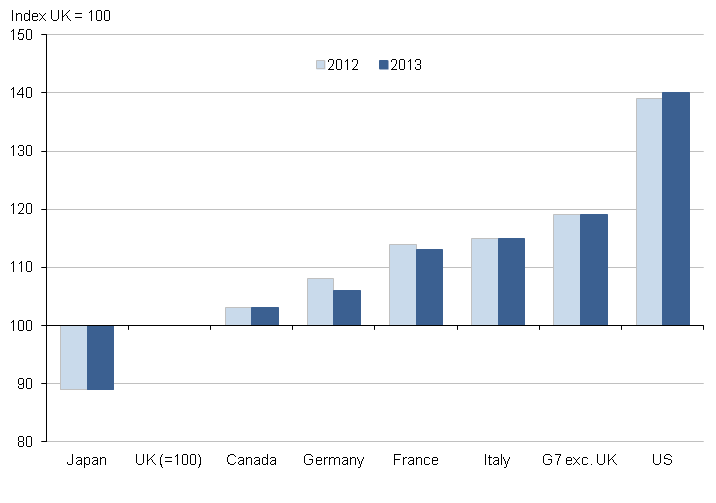
Revised estimates for 2013 show that UK output per worker was:
above that of Japan by 11 percentage points
below that of Canada and Germany by 3 and 6 percentage points respectively
below that of France and Italy by 13 to 15 percentage points
below that of the US by 40 percentage points, the largest differential recorded since this series began in 1990
below that of the rest of the G7 by 19 percentage points
Figure 2: GDP per worker, G7 countries
Source: Office for National Statistics
Download this image Figure 2: GDP per worker, G7 countries
.png (13.9 kB) .xls (74.2 kB)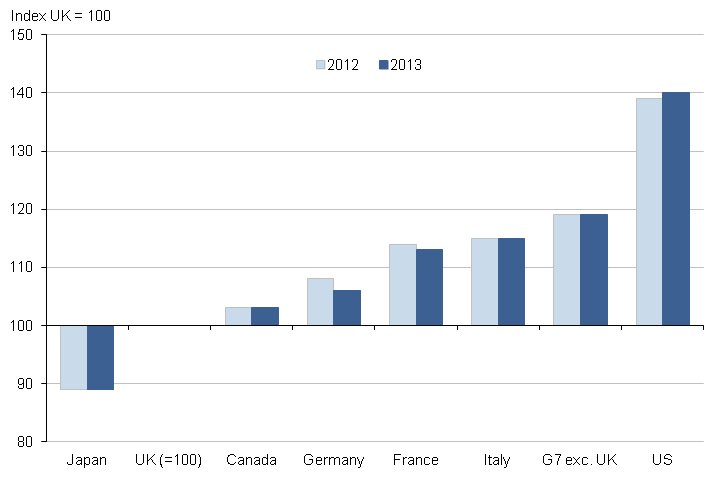
As illustrated in Figure 3, there are significant differences in average hours worked across the G7 reflecting cultural and compositional differences between countries. Different movements in average hours across countries account for differences in the patterns of productivity shown in figures 1 and 2. For example, the productivity gap between the UK and the US is larger in terms of output per worker than in terms of output per hour because, on average, US workers work more hours than UK workers. On the other hand, the productivity differential between the UK and Germany is wider in terms of output per hour, as German workers work fewer hours than their UK counterparts.
The general trend across the G7 as a whole is towards lower hours, perhaps reflecting workers preference for more leisure time as living standards rise over time. Average hours worked in the UK are close to the G7 average, with some evidence of an upturn in 2012 and 2013.
Figure 3: Average weekly hours per worker, G7 countries
Source: Office for National Statistics
Notes:
- G7 average hours is unweighted.
Download this chart Figure 3: Average weekly hours per worker, G7 countries
Image .csv .xls6. Constant price productivity
Constant price productivity estimates are indexed to 2007=100 and show the evolution of labour productivity for each country and group of countries over time. Further information is available in Tables 3 and 4 in the reference table (219 Kb Excel sheet) component of this release and at the back of the PDF version of this statistical bulletin. The following commentary focuses on GDP per hour worked, which, by allowing for movements in average hours worked, provides a more comprehensive measure of movements in productivity than GDP per worker.
GDP per hour worked (Table 3)
Figure 4 shows GDP per hour worked for the UK and an aggregated series for the rest of the G7, together with simple projections based on average productivity growth over 1997-2007, that is, before the global economic downturn. On this basis, the combination of strong UK productivity growth up to 2007 and weak productivity performance since 2007 implies a productivity gap of around 15-16% in 2013.
Figure 4: Constant price GDP per hour worked, actuals and projections
Source: Office for National Statistics
Download this chart Figure 4: Constant price GDP per hour worked, actuals and projections
Image .csv .xlsAverage annual productivity growth between 1997 and 2007 for the rest of the G7 was lower than the UK (around 1.8% per year, compared with 2.3% for the UK) and the productivity performance since 2007 has on average been somewhat stronger, implying a productivity gap for the rest of the G7 of around 6% in 2013.
Figure 5 illustrates the difference in productivity trajectories over recent years between the main European economies on the one hand, and North America and Japan on the other hand. Output per hour fell sharply in most countries over the 2008-09 downturn, but then rebounded sharply in Japan, Canada and - especially - the US. However, the recovery in productivity has been weaker and more in line with the UK experience in France, Germany and Italy.
Figure 5: Constant price GDP per hour worked, selected G7 countries
Source: Office for National Statistics
Download this chart Figure 5: Constant price GDP per hour worked, selected G7 countries
Image .csv .xlsConverting the time series in figure 5 into productivity gaps (calculated as in figure 4) for 2013 would yield gaps of around 11% for Germany but only around 4% for Italy. This is because trend productivity growth in the period prior to the economic downturn was much weaker in Italy than in Germany.
Back to table of contents7. Comparisons of productivity net of capital consumption (NOT NATIONAL STATISTICS)
As noted above, this release contains estimates of current price productivity after taking account of depreciation of fixed capital such as offices, factories, plant and equipment. Depreciation is sometime referred to as consumption of fixed capital and can be interpreted as the value "used up" in the production process.
The rationale rests on the argument that one of the causes of variance in labour productivity between different countries is that average levels of capital per worker can vary. Higher levels of capital per worker should mean higher output per worker but ought also to be associated with higher amounts of capital "used up". So the argument is that measures of productivity based on NDP should display less variance across countries than the equivalent measures using GDP, and that NDP productivity is a better gauge of a country's sustainable level of output.
By accounting for the value that would need to be set aside to leave the value of a country's capital stock unchanged, NDP can also be seen as preferable to GDP as a measure of a country’s sustainable living standards. As an analogy, households are likely to take depreciation of their capital assets such as cars and furniture into account in gauging their living standards over the medium term, so it makes sense for economic policy makers also to take account of depreciation of productive assets.
It should be noted that NDP estimates of productivity in this release are experimental and do not have National Statistics status. One reason for interpreting these estimates with caution is that methodologies used in deriving estimates of capital consumption vary across countries. For example, in practice capital consumption is estimated using country-specific assumptions about asset lives and depreciation profiles, rather than international benchmarks. This means that the depreciation charge for a particular type of capital asset of a particular vintage (for example, a one-year old tractor) may vary considerably from country to country.
A further caveat is that PPPs used to convert national measures of output are based on the basket of goods and services that comprise GDP, and do not take account of capital consumption.
There are additional issues in converting from current price to constant price measures of capital consumption, since the choice of deflators is not straightforward. This is one reason why we are not publishing constant price productivity estimates based on NDP in this release.
As always, ONS welcomes feedback from users on the value of these estimates.
Figure 6: NDP per hour worked, G7 countries

Source: Office for National Statistics
Download this image Figure 6: NDP per hour worked, G7 countries
.png (16.3 kB) .xls (74.2 kB)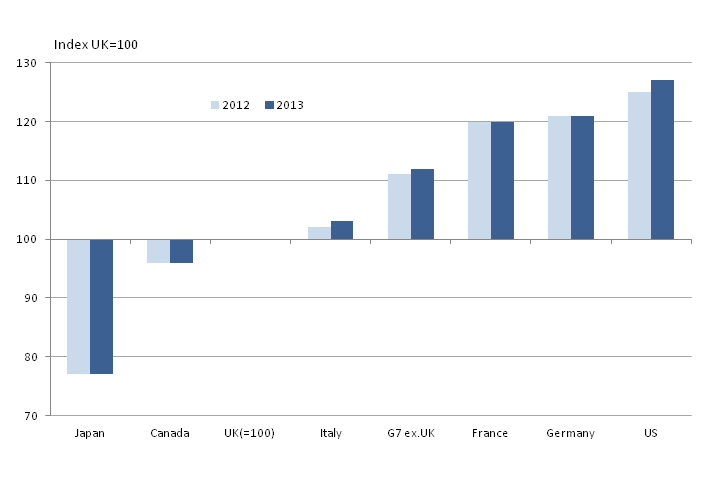
Figure 6 shows levels of NDP per hour worked, equivalent to the GDP-based estimates in figure 1. Comparing the two sets of estimates it is apparent that, as anticipated, productivity differences between the UK and the high productivity countries (France, Germany and the US) are not as great in terms of NDP as in terms of GDP. For example, the productivity differential between the UK and the US in 2013 is 27 percentage points in figure 6 (NDP basis), compared with 31 percentage points in figure 1 (GDP basis).
Most of the productivity differential between the UK and Italy disappears when NDP is used as the numerator, while the UK's productivity advantage over Japan widens considerably, from 15 percentage points in 2013 (GDP) to 23 percentage points (NDP)1. Against the rest of the G7 combined, UK productivity is estimated to be 12 percentage points lower in 2013 in terms of NDP, compared with 17 percentage points for the GDP-based estimates.
Notes for comparisons of productivity net of capital consumption (NOT NATIONAL STATISTICS)
- The deterioration in Japan's productivity performance when NDP is used as the numerator suggests that Japan's stock of fixed capital is (a) relatively large and (b) relatively unproductive, compared with similar assets in other G7 countries.
8. Comparisons with other countries (NOT NATIONAL STATISTICS)
In this section we update estimates for productivity comparisons between the UK and a group of smaller European countries last published in February 2014. As in the main estimates, these revert to GDP as the measure of economic output. These estimates have not been assessed by the UK Statistics Authority and therefore do not have National Statistics status.
Current price comparisons of GDP per hour worked are shown in figure 7 for 2012 and 2013. Longer time series are available in Table 5 (GDP per hour) and Table 6 (GDP per worker) in the reference table (219 Kb Excel sheet) component of this release. Comparatively large upward revisions to GDP estimates for the Netherlands reflecting adoption of ESA 2010 accounting standards have contributed to a widening of the productivity differential over the UK.
Figure 7: GDP per hour worked, additional countries
Source: Office for National Statistics
Download this image Figure 7: GDP per hour worked, additional countries
.png (14.8 kB) .xls (74.2 kB)
Constant price growth of output per hour for these additional countries is shown in figure 8, with UK growth included for comparison purposes. These series can be compared with the G7 estimates in Table 3. Figure 8 shows that since the economic downturn Spain, Netherlands and Ireland have experienced relatively rapid growth in output per hour.
In the case of Spain this is in sharp contrast to the very sluggish trend in productivity over the period 1997-2007. Indeed, the Spanish productivity gap in 2013 calculated on the same simplistic basis as for the G7 countries was minus 10% (that is, productivity was 10% above an extrapolation of the pre-downturn trend).
Output per hour in Ireland grew at a broadly similar average rate to that of the UK over the period 1997-2007. But as can be seen in figure 8 the recovery in productivity in Ireland since the downturn has been much more pronounced, resulting in a smaller productivity gap of around 7%.
Figure 8: Constant price GDP per hour worked, additional countries
Source: Office for National Statistics
Download this chart Figure 8: Constant price GDP per hour worked, additional countries
Image .csv .xls9. Revisions
Historical data used in this publication are subject to revision between publications. Tables R1 to R4 in the reference table (219 Kb Excel sheet) component of this release and at the back of the PDF version of this statistical bulletin compare the latest estimates with estimates from the previous release on 17 October 2014. Note that because Tables 1 and 2 are indexed to UK=100, revisions to the UK are zero by definition in Tables R1 and R2.
The main revisions are as follows:
Current and constant price GDP has been revised upwards for Canada (2011-13) and Japan (2012-13)
Constant price GDP has been revised slightly downwards for the UK in 2013
PPPs were revised in December 2014 to reflect a new methodology used to estimate PPPs between benchmark years (2011, 2008, 2005 etc). More information is available on the OECD website. Further revisions to PPPs reflect revisions to implicit GDP deflators arising from implementation of ESA 2010 accounting standards. The largest revisions are in 2012 and 2013, but there are also revisions all the way back to 1990, especially for Canada. The effect of the recent revisions is broadly to reduce the value of US output relative to other countries in 2012 (thus narrowing the productivity differential over the UK) and raise the value of US output relative to other countries in 2013.
There are no revisions to employment and hours worked in the G7 countries in this release.
Back to table of contents