Table of contents
- Main points
- Overview
- Your views matter
- SET expenditure 2012
- SET Expenditure by sectors of the UK government
- Research councils expenditure on SET decreased by 4% in 2012 compared with 2011
- Civil departments expenditure on SET was £2.4 billion in 2012, broadly unchanged from 2011
- HEFCs expenditure on SET increased by £0.3 billion from 2001
- Ministry of Defence 2012 R&D expenditure decreased by 45% compared with 2001
- Indicative UK contributions to EU R&D expenditure
- Background notes
1. Main points
- In 2012, £10.0 billion was spent on Science, Engineering and Technology (SET) by the UK Government. Allowing for inflation (in constant prices), this was a 1% decrease compared with 2011, and continued the downward trend in SET expenditure since 2009. These reductions were driven by Research Councils, Higher Education Funding Councils and the Ministry of Defence
- The UK Research Councils contributed the most to expenditure on SET in 2012 at £3.2 billion, 32% of all expenditure on SET
- Between 2001 and 2012, defence expenditure on SET decreased by £1.2 billion in constant prices. This was offset by an increase in Research Councils’ expenditure on SET of almost £1.0 billion in the same period
- The 2012 indicative UK contributions to the EU’s Research and Development (R&D) expenditure were £0.7 billion, and the amount spent on knowledge transfer in 2012 was £0.3 billion
2. Overview
Science, Engineering and Technology (SET) expenditure by the UK government includes expenditure by government departments, Research Councils and Higher Education Funding Councils (HEFCs). It also includes the indicative UK contributions to the European Union’s (EU) research and development expenditure. This should not be confused with the UK Gross Domestic Expenditure on R&D, 2012 (GERD) statistical bulletin, which only includes expenditure on R&D performed within UK borders, but by all sectors of the economy (see Background Note 1). R&D is the main component of the SET statistics.
These estimates were previously published by the Department for Business, Innovation and Skills (BIS) and were referred to as 'SET Statistics'. For clarification, please note that BIS included the year of publication in the SET Statistics title, not the year the data referred to. The title of this SET Statistical Bulletin includes the date to which the latest data refers, which is 2012.
For the purpose of SET statistics, UK government expenditure on SET consists of:
Research and Development (R&D)
knowledge transfer activities (including technology transfers) which are associated with research and experimental development, and contribute to the dissemination and application of scientific and technical knowledge
indicative UK contributions to the European Union’s (EU) R&D expenditure
This definition of SET excludes all other scientific, technical, commercial and financial steps that are often necessary for the successful development and marketing of new or improved products, processes or services.
Two types of estimates are presented in this release, current and constant prices. Estimates in current prices present the value of expenditure in cash terms. Constant price estimates have been adjusted for inflation between years using the Gross Domestic Product (GDP) deflator. This allows changes in the volume of government expenditure on SET to be examined on a more comparable basis over time.
Also included with this release, are data tables referring to the personnel associated with scientific and technical postgraduate education and training. These provide data on the numbers of persons with higher education qualifications, their employment status and their type of occupation. These are sourced from ONS’ Labour Force Survey, and are used in policy analyses.
In this statistical bulletin, R&D and related concepts follow internationally agreed standards defined by the Organisation for Economic Cooperation and Development (OECD), as published in the ‘Frascati’ Manual. This manual defines R&D as “creative work undertaken on a systematic basis in order to increase the stock of knowledge, including knowledge of man, culture and society and the use of this stock of knowledge to devise new applications”.
The Frascati Manual was originally written by, and for, the experts in OECD member countries that collect and issue national data on R&D. The definitions provided in this manual are internationally accepted and now serve as a common language for designing and evaluating science and technology policy.
Estimates in this release have the status of Official Statistics as they have not been assessed by the UK Statistics Authority (see Background Note 2).
The data in this bulletin and associated data tables relate to financial years. The main source of expenditure data for both this publication and the UK GERD publication is the annual Government Research and Development survey (GovERD).
Catapult centres
Catapult Centres are a new government initiative and have been created by the Technology Strategy Board to promote growth in R&D. To achieve this, the government has linked business and academia through these Catapult Centres. A Catapult is a technology and innovation centre where the best of the UK's businesses, scientists and engineers can work side by side on R&D, transforming ideas into new products and services to generate economic growth.
Back to table of contents3. Your views matter
We are aiming to improve this release and its associated commentary. We would welcome any feedback you might have, and would be particularly interested in knowing how you make use of these data to inform your work. Please contact us via email: RandD@ons.gov.uk.
Back to table of contents4. SET expenditure 2012
In 2012, £10.0 billion was spent on SET by the UK government, an increase of 1% in current prices compared with 2011. In constant prices, SET expenditure decreased by 1% compared with 2011, but increased by 4% compared with £9.6 billion in 2001. There has, however, been a downward trend since 2009 in SET expenditure, with reductions in expenditure in constant prices, driven by the Research Councils, HEFCs and the Ministry of Defence (Figures 1 and 4).
Figure 1: UK Government expenditure on SET, 2001 to 2012
Source: Office for National Statistics
Download this chart Figure 1: UK Government expenditure on SET, 2001 to 2012
Image .csv .xlsFigure 2 shows UK government expenditure on SET as a percentage of GDP. Total expenditure on SET in 2012 represented 0.63% of GDP. This estimate is in line with recent years and is broadly unchanged from 2011.
Figure 2: UK Government expenditure on SET as a percentage of GDP, 2001 to 2012
Source: Office for National Statistics
Download this chart Figure 2: UK Government expenditure on SET as a percentage of GDP, 2001 to 2012
Image .csv .xls5. SET Expenditure by sectors of the UK government
The UK government’s expenditure on SET can be categorised into expenditure by Research Councils, HEFCs, and also into civil and defence departments. The indicative UK contributions to EU R&D expenditure provided by HM Treasury are also included in SET expenditure. Figure 3 shows the contribution each of these made to the 2012 total SET estimate. Almost a third (32%) of UK government expenditure on SET was spent by Research Councils, with civil departments and HEFCs contributing 24% and 22% respectively.
Figure 3: The components of UK Government expenditure on SET, 2012
£10.0 billion
Source: Office for National Statistics
Download this chart Figure 3: The components of UK Government expenditure on SET, 2012
Image .csv .xlsFigure 4 shows the changes in these SET components between 2001 and 2012 in constant prices. Between 2001 and 2012, defence expenditure decreased by £1.2 billion in constant prices, from £2.7 billion in 2001 to £1.5 billion in 2012 (45%). This has been compensated for by an increase in Research Councils’ expenditure on SET of almost £1 billion in the same period, due to increased investment in the research budget.
There is no specific reason why the expenditure by the defence department peaked in 2002, but it was during a time of changing internal structures, the introduction of new accounting systems, as well as a review to ensure that Frascati Manual definitions were being adhered to. Caution is therefore advised when using SET defence data for this period, as it is likely to be overestimated. Please see Background Note 10 for more information on defence statistics.
The UK indicative contributions to the EU’s R&D expenditure increased by 54% between 2007 and 2008 in constant prices. They have remained at the same level of £0.7 billion since then. The initial rise was related to member states’ contributions being increased to meet the needs of the growing number of EU member states.
Figure 4: The components of UK Government expenditure on SET, 2001 to 2012
Source: Office for National Statistics
Download this chart Figure 4: The components of UK Government expenditure on SET, 2001 to 2012
Image .csv .xls6. Research councils expenditure on SET decreased by 4% in 2012 compared with 2011
Research Councils UK (RCUK) is the strategic partnership of the UK's seven Research Councils. Each year the Research Councils perform research covering the full spectrum of academic disciplines, from the medical and biological sciences to astronomy, physics, chemistry, engineering, social sciences, economics, environmental sciences and the arts and humanities.
In 2012, expenditure on SET by Research Councils was £3.2 billion, a decrease of £0.1 billion (4%) compared with 2011 in constant prices, and a decrease from the peak of £3.5 billion in 2006. The most recent decrease was mainly due to the completion of capital expenditure contributions to the new MRC Laboratory of Molecular Biology and the Francis Crick Institute.
The Research Council with the highest expenditure on SET at £0.9 billion in 2012 was the Engineering and Physical Sciences Research Council (EPSRC). This represented 29% of all Research Council’s expenditure on SET.
The Research Councils’ estimated expenditure on SET includes their pension arrangements. These pension contributions are included separately on the data tables associated with this publication (Figure 5).
Figure 5: Breakdown of UK Research Councils’ expenditure on SET, 2012
£3.2 billion
Source: Office for National Statistics
Notes:
- EPSRC = Engineering and Physical Sciences Research Council; MRC = Medical Research Council; BBSRC = Biotechnology and Biological Sciences Research Council; STFC = Science and Technology Facilities Council; NERC = Natural Environment Research Council; ESRC = Economic and Social Research Council; AHRC = Arts and Humanities Research Council
Download this chart Figure 5: Breakdown of UK Research Councils’ expenditure on SET, 2012
Image .csv .xls7. Civil departments expenditure on SET was £2.4 billion in 2012, broadly unchanged from 2011
The UK government owns many research institutes and laboratories that carry out R&D. It also uses a range of different suppliers with facilities to carry out research, both inside and outside the UK.
In 2012, expenditure by civil departments on SET was £2.4 billion, broadly unchanged in constant prices from 2011, but a decrease from the peak of £2.7 billion in 2003. Five departments contributed £2.3 billion (94%) to the 2012 total. The civil department with the largest expenditure on SET was the Department of Health (£0.9 billion) which represented 39% of total civil departments’ expenditure on SET (Figure 6).
Figure 6: Breakdown of UK Government Civil Departments’ expenditure on SET, 2012
Constant prices in £ billion
Download this chart Figure 6: Breakdown of UK Government Civil Departments’ expenditure on SET, 2012
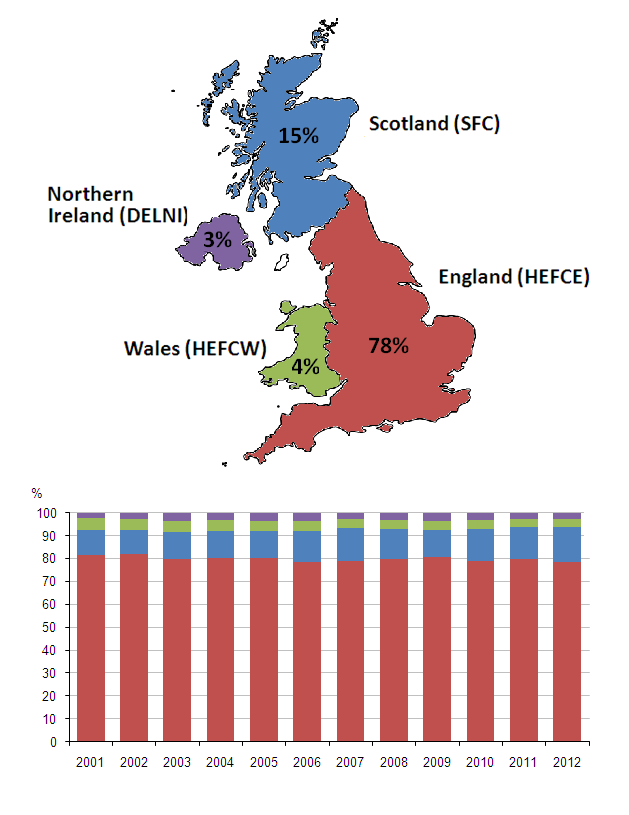
Image .csv .xls8. HEFCs expenditure on SET increased by £0.3 billion from 2001
HEFCs promote and fund teaching and research in Higher Education Institutions (HEIs).
All HEIs (including universities) provide finance statistics to the Higher Education Statistics Agency (HESA). A method has been established between the HEFCs, BIS and ONS to estimate government funded R&D expenditure in HEIs by using grant income as a proxy for expenditure. Please see Background Note 4 for more information.
In 2012, expenditure by the HEFCs' on SET was £2.2 billion, an increase of £0.3 billion in constant prices since 2001, but a decrease from the peak of £2.6 billion in 2009 (Figure 4).
The funding council for England (HEFCE) provides the most research funding as it has the highest number of HEIs. In 2012, expenditure by HEFCE on SET was £1.7 billion. This was 78% of the total HEFCs expenditure on SET, a similar level to recent years (Figure 7).
Figure 7: Higher education funding councils’ expenditure on SET, 2001 to 2012
Source: Office for National Statistics
Download this image Figure 7: Higher education funding councils’ expenditure on SET, 2001 to 2012
.png (62.3 kB) .xls (30.2 kB)
9. Ministry of Defence 2012 R&D expenditure decreased by 45% compared with 2001
In 2012, expenditure on SET by the Ministry of Defence (MoD) was £1.5 billion, an increase in constant prices of £0.1 billion (10%) compared with 2011, and a decrease of £1.2 billion (45%) since 2001. This was mainly due to a decrease in development expenditure of £1.1 billion, with some large projects moving from the development phase into the manufacturing stage of their programmes, and not being replaced with other high value projects (Figure 8).
Figure 8: Defence expenditure on SET by Research and Development, 2001 to 2012
Source: Source: Office for National Statistics
Download this chart Figure 8: Defence expenditure on SET by Research and Development, 2001 to 2012
Image .csv .xls10. Indicative UK contributions to EU R&D expenditure
In 2012, the indicative contributions that the UK made to the EU’s R&D expenditure, were £0.7 billion. This is an increase in constant prices of £0.2 billion (42%) since 2001. These figures were provided by HM Treasury and are broad estimates. This is because Member States’ contributions are not made to individual expenditure programmes, but to the EU budget as a whole. They are therefore referred to as the “indicative UK contributions to EU R&D expenditure”.
Back to table of contents