Table of contents
- Correction
- Key findings
- Background
- Guidance on interpreting the results
- Quality of care
- Dignity and respect
- Coordination of care
- Relief of pain and suffering
- Decision making
- Preferences and choice at the end of life
- Support for relatives, friends or carers at the end of life
- Quality of care for people with dementia contributing to death
- Sample
- Sex of deceased
- Cause of death
- Place of death
- Age at death
- Geographical spread
- Response rates
- Survey administration and methods
- Uses and users of end of life care statistics
- Policy changes and development of the questionnaire
- Further information
- Acknowledgements
- References
- Background notes
- Methodology
1. Correction
It came to our attention on the 21st of July 2014 that we incorrectly reported a key finding on "preference to die at home". This was corrected on the 22nd of July.
ONS apologises for any inconvenience caused.
Back to table of contents2. Key findings
Overall quality of care has not changed significantly between 2011, 2012 and 2013
Quality of care was rated significantly lower for people who died in a hospital, compared to people dying at home, in a hospice or care home
For those dying at home, the quality of coordination of care was rated significantly lower in 2013 compared to 2012
The dignity and respect for patients shown by hospital nurses and hospice nurses has increased between 2011 and 2013
Pain is relieved most effectively in the hospice setting (62%) and least effectively at home (18%)
Only half of people (50%) who express a preference to die at home, actually die at home
3. Background
The National Survey of Bereaved People (VOICES, Views of Informal Carers – Evaluation Of Services) collects information on bereaved peoples’ views on the quality of care provided to a friend or relative in the last three months of life, for England. The survey has now been run for three years and was commissioned by the Department of Health in 2011 and 2012, and NHS England in 2013. It is administered by the Office for National Statistics (ONS).
VOICES data provides information to inform policy requirements, including the End of Life Care Strategy, published by the Department of Health in July 2008. This set out a commitment to promote high quality care for all adults at the end of life and stated that outcomes of end of life care would be monitored through surveys of bereaved relatives (Department of Health, 2008).
The 2011 and 2012 survey publications were titled ‘National Bereavement Survey’. Following a request from the external steering group for this survey, the name has been changed to ‘National Survey of Bereaved People’. This is to clarify that the survey is asked of bereaved people, rather than about bereavement.
This Statistical Bulletin reports on the national results from the 2013 VOICES survey and provides comparisons with findings from the 2011 and 2012 VOICES surveys ONS, 2012a, and ONS, 2013a). NHS Area Team findings for the combined results of the 2011 and 2012 surveys can be seen in the bulletin: National Survey of Bereaved People (VOICES) by NHS Area Team (England), 2011 – 2012; bereaved peoples’ views on care at the end of life.
Back to table of contents4. Guidance on interpreting the results
The VOICES survey is based on a sample and as such is subject to variability in the results found. To aid interpretation, the results are presented with confidence intervals in reference table 1 (424 Kb Excel sheet) . Confidence intervals enable comparisons to be drawn between groups or areas and indicate the amount of uncertainty there is around a figure (the larger the interval, the greater the uncertainty). Where confidence intervals between two figures overlap, we cannot say with certainty that there is more than a chance difference between the figures (see background note 9).
The survey routes respondents to questions relevant to their situation and therefore some questions have more responses than others. For instance, fewer people experienced care in hospices and the number of responses to hospice related questions is far lower than to questions on themes such as support provided to carers at the end of a life, which are relevant to all respondents. Questions with fewer responses are less robust and consequently have wider confidence intervals, reducing the likelihood of significant differences. As well as question response differences, VOICES is also subject to response bias and it is important to remember that the survey reflects the views of responders only and nothing is known about the experiences of people who do not respond. The survey data is weighted to account for probability of selection and response bias (see background note 6). More information on the sample characteristics can be found under the sample section of this report.
Where figures are quoted from 2011 and 2012, these can be accessed in the two previous annual bulletins (ONS, 2012a, and ONS, 2013a).
Back to table of contents5. Quality of care
Ratings of the overall quality of care across all services in the last three months of life were reported by most respondents (96%). Of these 13% rated the care as outstanding, 30% as excellent, 33% as good, 14% as fair and 10% as poor (see ‘Overall quality of care’ table in the reference table 1). Figure 1 presents ratings of overall quality of care across all services in the last three months of life, for 2013.
Figure 1. Ratings of overall quality of care across all services in the last three months of life
England 2013

Source: National Bereavement Survey (VOICES) - Office for National Statistics
Notes:
- Error bars show confidence intervals for each figure. See background note 9.
Download this image Figure 1. Ratings of overall quality of care across all services in the last three months of life
.png (17.6 kB) .xls (27.1 kB)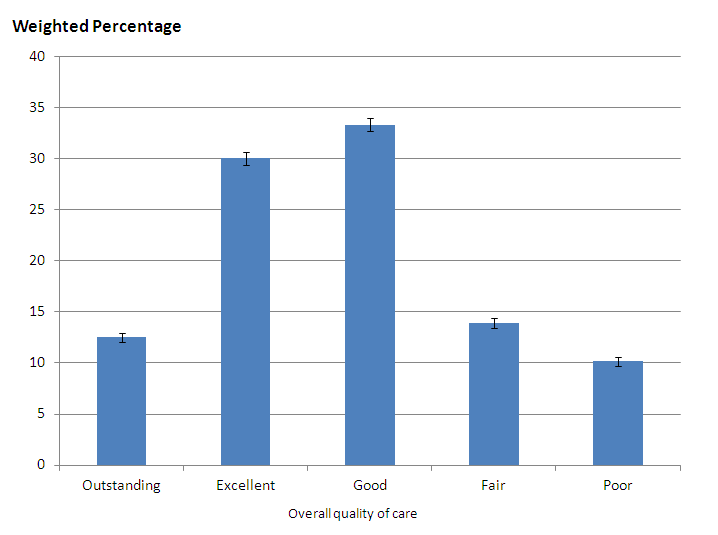
As shown in Table 1, there has been no significant change in overall quality of care between 2011 (43%), 2012 (44%) and 2013 (43%). Quality of care rated as outstanding or excellent remains highest for people who died from cancer (51% rating care as outstanding or excellent each year) and is significantly lower for those who died in hospital than any other location (33% rating care as outstanding or excellent in 2013). Almost half of the sample (48%) died in hospital and half of all deaths in England (ONS, 2013d) occur in hospitals. This indicates the importance of providing high quality care in this setting. While government policy is stressing the need for quality end of life care within hospitals (Department of Health, 2008), the data shows that hospitals are still lagging behind other care settings. An audit of hospital care recommended that specialist palliative care should be more accessible within hospitals and training on care for dying patients should be mandatory for all staff (Royal College of Physicians, 2014).
Table 1: Overall quality of care rated as outstanding or excellent
| 2013 | 2012 | 2011 | ||||||||
| Weighted % | LCL | UCL | Weighted % | LCL | UCL | Weighted % | LCL | UCL | ||
| All responses | 42.6 | 41.5 | 43.6 | 43.8 | 42.8 | 45.0 | 42.5 | 41.4 | 43.6 | |
| Cause of death | ||||||||||
| Cardiovascular disease | 37.7 | 35.7 | 39.7 | 40.1 | 38.1 | 42.2 | 36.9 | 35.0 | 39.0 | |
| Cancer | 50.5 | 48.4 | 52.7 | 50.9 | 48.9 | 53.0 | 50.9 | 48.8 | 53.1 | |
| Other | 40.5 | 38.9 | 42.0 | 40.9 | 39.3 | 42.5 | 39.7 | 37.9 | 41.4 | |
| Place of death | ||||||||||
| Home | 53.2 | 50.5 | 55.9 | 53.0 | 50.4 | 55.7 | 53.7 | 51.0 | 56.6 | |
| Hospital | 32.7 | 31.4 | 34.1 | 34.0 | 32.5 | 35.4 | 32.6 | 31.2 | 34.1 | |
| Care home | 50.8 | 48.7 | 53.0 | 52.2 | 50.0 | 54.5 | 51.3 | 48.8 | 53.8 | |
| Hospice | 59.0 | 54.0 | 64.1 | 58.0 | 53.6 | 62.8 | 59.1 | 54.4 | 64.1 | |
| Source: Office for National Statistics | ||||||||||
| Notes: | ||||||||||
| 1. Percentages may not sum to 100 due to rounding. | ||||||||||
| 2. Percentages are calculated using sampling and non-response weights. | ||||||||||
| 3. These statistics are based on sample data and are estimates of the population. | ||||||||||
| 4. LCL lower confidence level. | ||||||||||
| 5. UCL Upper confidence level. | ||||||||||
Download this table Table 1: Overall quality of care rated as outstanding or excellent
.xls (23.0 kB)Reference table 1 contains results of quality of care ratings within each health care setting. Quality of care remains highest for people who died of cancer when comparing all health care settings. Of respondents who rated care provided by hospices, 77% rated it as excellent. This is significantly higher than for any other health care setting and indicates the importance of specialist palliative care. See reference table 1 (424 Kb Excel sheet) (Quality of care (3mnth) tab).
Back to table of contents6. Dignity and respect
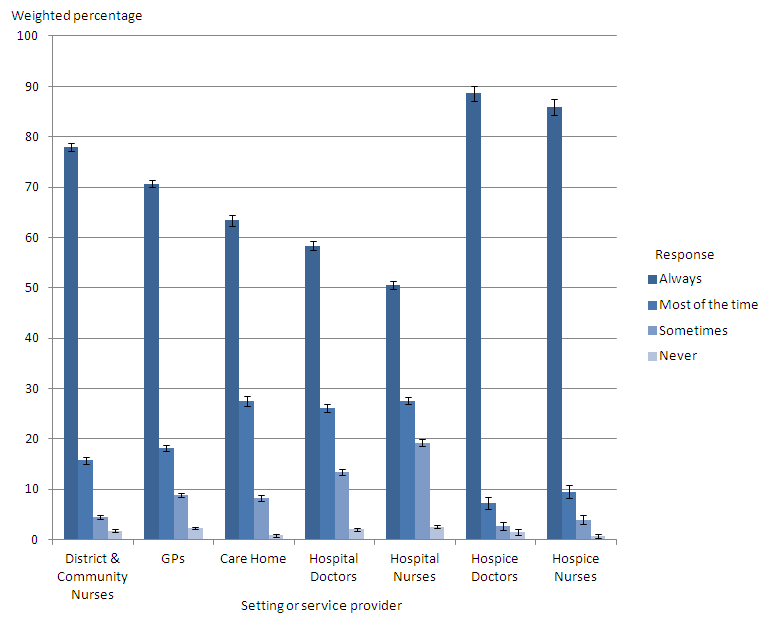
Another aspect of care analysed was whether staff treated the patient with dignity and respect. Staff in hospices received the highest proportion of always showing dignity and respect in the last three months of life (89% for hospice doctors and 86% for hospice nurses). Hospital staff received the lowest proportion always showing dignity and respect (58% for hospital doctors and 51% for hospital nurses). While dignity and respect from nurses is generally reported as lower than from doctors, it has increased significantly for hospital nurses (48% in 2011 to 51% in 2013) and hospice nurses (81% in 2011 to 86% in 2013). Dignity and respect from other professionals has remained unchanged when comparing results from the last three years.
Figure 2 presents information on how often the patient was treated with dignity and respect in the last three months by setting or service provider in 2013.
Figure 2. How often the patient was treated with dignity and respect in the last three months, by setting or service provider
England 2013
Source: National Bereavement Survey (VOICES) - Office for National Statistics
Download this image Figure 2. How often the patient was treated with dignity and respect in the last three months, by setting or service provider
.png (23.1 kB) .xls (31.7 kB)
Dignity and respect from health care professionals is reported as higher for people who die of cancer, although this is only significant within hospices. Differences in dignity and respect shown to people of different ages tend to be small and non significant. Further details of responses related to dignity and respect reported by: the different care settings and services used in the last three months and the last two days of life, and by cause and age at death are provided (see ‘Dignity and Respect 3 months’ and ‘Dignity and Respect 2 days’ tables in reference table 1 (424 Kb Excel sheet)).
Back to table of contents7. Coordination of care
Two questions were asked about coordination of care. One question was asked in relation to those patients who had spent some or all of the last three months at home, about whether community services worked well together. For those who responded to this question, 42% said that the services definitely worked well together, representing a significant fall from 45% in 2012.
The second question was asked in relation to those patients who had spent some time in hospital in the last three months and whether hospital services worked well with the GP and other community services. Here, 31% reported these services definitely worked well together and a further 36% said they worked well to some extent. Statement 8 of the NICE Quality standards for End of Life Care for Adults emphasises the importance of effectively coordinated care across all relevant settings (NICE, 2011). See ‘Coordination of care’ table in reference table 1 (424 Kb Excel sheet) .
Back to table of contents8. Relief of pain and suffering
Figure 3 presents results on how well pain was relieved during the last three months of life, by care setting. Questions on relief of pain were relevant only for certain patients. Where it was relevant, relief of pain was reported as being provided ‘completely, all of the time’ most frequently for patients in hospices (62%) and least frequently for those at home (18%). There have been no significant changes in patterns of pain relief in different settings between 2011 and 2013. Pain relief does not vary significantly between cause of death or age of death in each setting (home, hospital, care home or hospice).
For further information, see ‘Relief of pain 3 months’ and ‘Relief of pain 2 days’ tables in reference table 1 (424 Kb Excel sheet).
Figure 3. How well pain was relieved during the last three months of life: by care setting, England, 2013
England 2013

Source: National Bereavement Survey (VOICES) - Office for National Statistics
Notes:
- Error bars show confidence intervals for each figure. See background note 9.
Download this image Figure 3. How well pain was relieved during the last three months of life: by care setting, England, 2013
.png (20.9 kB) .xls (30.2 kB)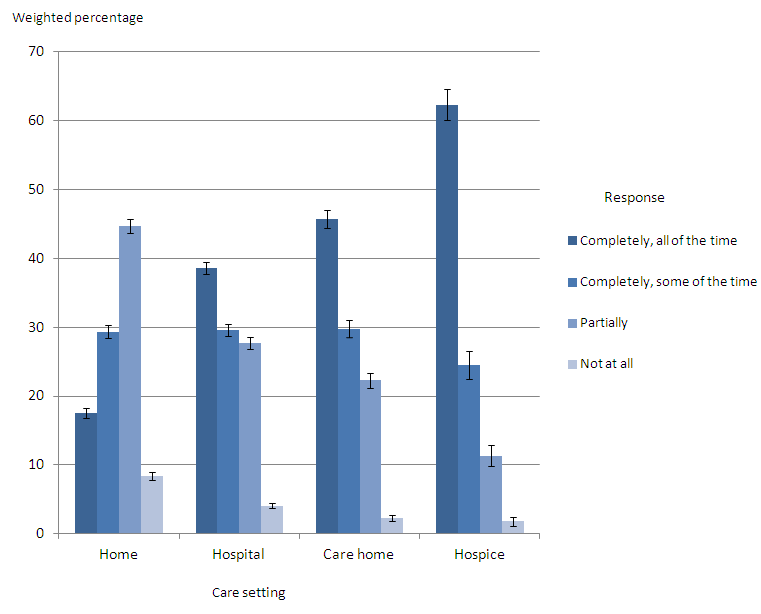
9. Decision making
Almost two-thirds of respondents (63%) reported that no decisions had been made about care which the patient would not have wanted. However, 17% of respondents said yes to this question. This pattern has remained unchanged since 2011.
Respondents reported that the majority of patients (86%) were involved in decisions about their care as much as they wanted. Statement 3 of the NICE Quality standards for End of Life Care for Adults emphasises the importance of people approaching the end of life feeling satisfied that they have been able to discuss, record and review their needs and preferences and take a role in planning and decision-making, if they would like to do so (NICE, 2011). Further details about decision making around care are reported in the ‘Patients needs and Preferences 3 months’ tables in reference table 1 (424 Kb Excel sheet), with results presented by cause of death, place of death and age at death.
Back to table of contents10. Preferences and choice at the end of life
Figure 4 presents information on people’s preferred place of death and the actual place of death. Only 32% of family members reported that their relative had expressed a preference of where they would like to die and gave further details. For those who expressed a preference, the majority preferred to die at home (79%) while a minority expressed a preference to die in hospital (3%). Previous findings from VOICES demonstrated that 53% of people died in their preferred place of choice, with most people who died at home wanting to die there (99%), and most people who died in hospital also wanting to die at home (85%) (ONS, 2014a).
The majority of people who say where they would like to die express a preference to die at home (79%), but only half (50%) of people who want to die at home actually die there. One third of people (35%) who want to die at home, die in hospital. A quality marker for end of life care is that the individual should be able to die in their place of choice but these statistics demonstrate that this often does not happen (Department of Health, 2009).
Figure 4. Preferred place of death: by actual place of death, England, 2013
England 2013

Source: National Bereavement Survey (VOICES) - Office for National Statistics
Notes:
- Error bars show confidence intervals for each figure. See background note 9.
Download this image Figure 4. Preferred place of death: by actual place of death, England, 2013
.png (18.3 kB) .xls (29.2 kB)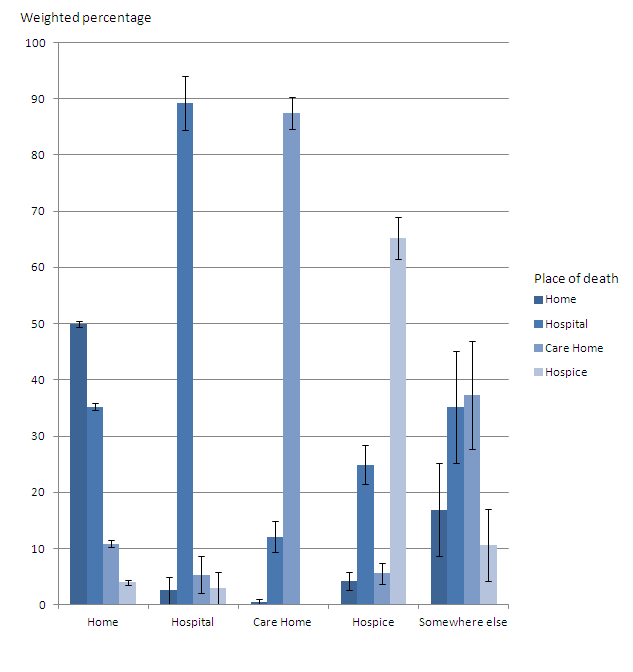
11. Support for relatives, friends or carers at the end of life
One set of questions asked about the support the respondent and family of the deceased received and whether they were dealt with sensitively. More than half of respondents (60%) said that they had definitely been given enough support at the time of the death. A further 26% said that they had to some extent.
When asked whether they had talked to anyone from any support services since the death, most respondents reported that they had not, and did not want to (68%). However, 18% said that they had not, but would have liked to. This was higher for female respondents (21% versus 14% for males) and younger respondents (23% for under 60 years and 15% for those 60 years and over). There have been no significant changes in these patterns since VOICES was first conducted in 2011.
The NICE Quality standards for End of Life Care for Adults (Statements 7 and 14) focuses on the importance of sensitive communication to those closely affected by death and the need to offer timely support ‘appropriate to their needs and preferences’ (NICE, 2011). Further information is presented in the ‘Support for carer 3 months’ and ‘Support for carer 2 days’ tables in reference table 1 (424 Kb Excel sheet).
Back to table of contents12. Quality of care for people with dementia contributing to death
Figure 5 presents ratings of overall quality of care across all services in the last three months of life, for people with and without dementia mentioned on the death certificate. Doctors are required to record dementia on a death certificate where it contributed to the death, or to the sequence of events leading to a death; it is not recorded in other cases (Dementia mentions are identified if ICD-10 codes F01, F03 and G30 are recorded on the death certificate, see background note 8.) For the whole sample, just 16% of people had dementia or senility mentioned on their death certificate. This varied across the cause of death groups. Where the underlying cause of death was cardiovascular disease, 7% also had a mention of dementia. For cancer deaths, the comparable figure was only 3%, while 30% of other deaths had dementia mentioned. Dementia was mentioned in 42% of care home deaths and almost one-quarter of patients aged 80 years or over (23%).
Overall quality of care where dementia was mentioned was rated significantly better than where there was no mention. Care quality was rated as outstanding/excellent in 47% of cases where dementia was mentioned on the death certificate, compared to 42% for no dementia ( See reference table 1 (424 Kb Excel sheet)). While this pattern was consistent in 2011, there were no significant differences between the two groups in 2012.
When comparing excellent quality of care in each setting for people with and without dementia mentioned, excellent care was rated less commonly for people with dementia mentioned on the death certificate. Excellent care was only rated higher for patients with dementia mentioned in care homes (45% no mention compared with 48% where dementia is mentioned), but this difference is not significant. The care of people with dementia mentioned was significantly worse from GPs (33% where dementia is mentioned compared to 30% where dementia is mentioned) and from hospital nurses (39% where dementia is not mentioned, compared with 35% where dementia is mentioned). However the quality of care from hospital nurses to patients with dementia mentioned has increased significantly when comparing 2011 and 2013 (29% to 35% of cases rated care as excellent).
Figure 5. Ratings of quality of care across all services in the last three months of life, for people with and without dementia mentioned on the death certificate
England 2013

Source: National Bereavement Survey (VOICES) - Office for National Statistics
Notes:
- Error bars show confidence intervals for each figure. See background note 9.
Download this image Figure 5. Ratings of quality of care across all services in the last three months of life, for people with and without dementia mentioned on the death certificate
.png (18.1 kB) .xls (22.0 kB)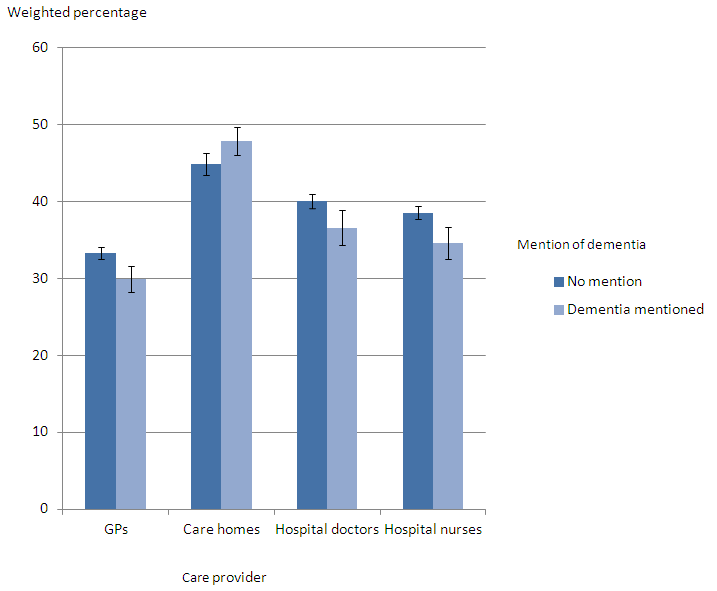
13. Sample
The sample for the 2013 VOICES survey was selected from the 168,719 adult deaths registered between 1st January 2013 and 30th April 2013, which were extracted from the death registration database held by ONS. Records were removed where cause of death and place of death were outside the criteria (see below), where the informant’s name and address was missing and where the informant was designated an official (See Background Note 5).
From the 150,111 deaths that were eligible for the survey, a stratified sample of 49,607 was drawn for the actual survey.
Informants were contacted between four and 11 months following the death, the recommended time for such surveys to balance the need for privacy and sensitivity during early bereavement while ensuring reliable recall about care provision (Hunt et al, 2011). The mailing period was also timed to exclude Christmas and the anniversary of the death. The VOICES-SF questionnaire was used: the Views of Informal Carers – Evaluation of Services (VOICES) short-form (see Background Note 4).
Back to table of contents14. Sex of deceased
This was determined from information recorded on the death certificate.
Male (44% of the selected sample)
Female (56% of the selected sample)
15. Cause of death
All details relevant to the cause of death on the death certificate are coded using the International Statistical Classification of Diseases and Related Health Problems – Tenth Revision, or ICD–10 (WHO, 1992).
Deaths were excluded from the sampling frame where the underlying cause of death was accident, suicide or homicide (ICD–10 codes V01 to Y98 and U50.9). The following deaths were included where they were recorded as the underlying cause:
Cardiovascular Disease (CVD): ICD–10 codes I00 to I99 (29% of the selected sample)
Cancer ICD–10 codes C00 to D48.9 (This includes benign neoplasms) (27% of the selected sample)
Other: ICD–10 codes A00 to R99 (excluding CVD and Cancer) (44% of the selected sample)
16. Place of death
Deaths were excluded where the place of death was recorded as 'Elsewhere', which includes external sites (such as roads or parks), public venues (such as shops or restaurants), work places and any other place which could not be identified to a specified location type. Location types that were included were grouped in the following way:
Home: the home of the deceased. (21% of the selected sample)
Hospital: NHS and private (50% of the selected sample)
Care Homes (including residential homes) (23% of the selected sample)
Hospices (5% of the selected sample)
In some cases, it may be appropriate to group residential homes with home, since these all describe the usual residence of the person. However, for the purposes of the 2013 VOICES survey, residential homes were grouped with care homes because the survey addresses the quality of care provided by staff. Figure 6 presents the distribution of the sample, by place and cause of death.
Figure 6. Distribution of the sample: by place of death and cause of death
England, 2013
Source: National Bereavement Survey (VOICES) - Office for National Statistics
Notes:
- CVD cardiovascular disease.
Download this chart Figure 6. Distribution of the sample: by place of death and cause of death
Image .csv .xls17. Age at death
Deaths of people aged under 18 years were excluded, leaving an age range of 18 to 110 years for the sample. Ages were split into three groups:
Under 65 years (12% of the selected sample)
65 to 79 years (28% of the selected sample)
80 years or older (60% of the selected sample)
This older age group becomes of greater importance as the number of older adults increases (ONS, 2014b), mortality rates fall (ONS, 2013d) and people live longer (ONS, 2013c).
Figure 7. Distribution of the sample: by cause of death and age at death
England, 2013
Source: National Bereavement Survey (VOICES) - Office for National Statistics
Notes:
- CVD cardiovascular disease.
Download this chart Figure 7. Distribution of the sample: by cause of death and age at death
Image .csv .xls18. Geographical spread
To ensure a geographical spread, death records were assigned to an NHS Area Team based on the postcode of usual residence of the deceased. In 2013, there were 25 NHS Area Teams covering the whole of England.
Back to table of contents19. Response rates
Of the sample of 49,607 deaths, 22,661 completed responses were received from informants, giving a response rate of 46%. The overall response rate is comparable to that achieved in the previous National VOICES questionnaire (ONS, 2012a, ONS, 2013a).
The ‘Response rates’ table presents the response rates by characteristics of the deceased. The ONS mortality database contains the name and address of informants of the death and, in most cases, the relationship of the informant to the deceased. No further information about the informant was available so it was not possible to estimate response rates based on respondent details. Although the questionnaire is sent to the informant on the death certificate, they are encouraged to pass on the questionnaire to another family member if deemed more appropriate. In the questionnaire, respondents were asked their age, sex, ethnic group and relationship to the deceased. Age and sex of the respondent is reported in the results, but was missing in 1.2% of cases for age, 5.8% of cases for sex, 2.2% for ethnic group and 1.9% for relationship to the deceased. Of those who stated the relationship, 99% were relatives.
Back to table of contents20. Survey administration and methods
All processes related to the administration of this survey were carried out within ONS. For details of the Survey Process, Data Scanning and Capture and Mechanisms for dealing with distress and complaints, see the bulletin for the first National Bereavement Survey (VOICES) and the Quality and Methodology Information paper for this survey.
Back to table of contents21. Uses and users of end of life care statistics
The findings from this survey will be used by a range of users to evaluate the quality of end of life care.
NHS England commissioned this survey to follow up on a commitment made in the Department of Health’s End of Life Care Strategy. The results of this survey will be used to inform policy decisions and to enable evaluation of the quality of end of life care in different settings, across different ages and different causes of death.
Quality of end of life care is one of the key areas in the NHS Outcomes Framework. This has relevance for Domain 2 ‘Enhancing quality of life for people with long-term conditions’ and Domain 4 ‘Ensuring that people have a positive experience of care’. Indicator 4.6 ‘Improving the experience of care for people at the end of their lives’ uses data from the National Survey of Bereaved People (VOICES) to gather bereaved carers’ views on the quality of care in the last three months of life.
Other key users include the range of organisations and people involved in end of life work. These include the National End of Life Care Intelligence Network, the National End of Life Care Programme, academics, health researchers and charities. Service providers and policy makers also use the information to help determine their needs and assess their performance.
It is anticipated that members of the public, including survey respondents, will have a particular interest in the results of this survey.
We welcome feedback from users on the content, format and relevance of this release. Data users can post or email feedback to the address found in the Background Notes section.
Back to table of contents22. Policy changes and development of the questionnaire
The Liverpool Care Pathway provided a protocol for end of life care which has received criticism in a recent review (NHS England, 2013a). Following this review, the Leadership Alliance for the Care of Dying People was established to deliver improvements in end of life care (NHS England, 2013b). The Leadership Alliance has published a commitment to priorities for improving care of the dying person, including improving communication between staff, the dying person and their carers, involving the dying person and their carers in decisions about their care, and providing an individual plan of care to meet physical and psychological needs of the dying person (Department of Health, 2014).
The VOICES questionnaire is currently being developed to take account of these policy changes. Future surveys will include questions on provision of fluid and nutrition and on the support and communication provided to carers by health care staff. Cognitive testing of these new questions has also lead to small changes in existing parts of the questionnaire. These changes will ensure the questionnaire continues to provide policy relevant information and is easy for respondents to complete.
These policy changes will affect the delivery of end of life care, furthering the importance of monitoring quality of care through surveys such as the National Survey of Bereaved People (VOICES).
Back to table of contents