Table of contents
- Main points
- Collaboration
- Things you need to know about this release
- Breast, prostate, lung and colorectal cancers continue to be the most common
- Cancer incidence over the last decade
- Cancer diagnoses increase with age
- Cancer incidence continues to be highest in the north of England and lowest in London
- Fewer people are dying from cancer in England
- Reported measures
- Cancer registration data
- Policy context
- Links to other related statistics
- Quality and methodology
- Acknowledgements
1. Main points
The number of new cases of cancer in England continues to rise and, in 2016, there were 303,135 cancers registered (excluding non-melanoma skin cancers); this is equivalent to 828 new cases being diagnosed each day during 2016.
Breast (15.2%), prostate (13.4%), lung (12.7%) and colorectal (11.5%) cancers continue to account for over half of the cancer registrations in England for all ages combined.
More cancers were registered in males (155,019) than females (148,116) and across the majority of cancer sites, more males were diagnosed with cancer than females; this is a persistent feature of the data, as reported in previous cancer registration years.
Cancer is primarily a disease of older people, with adults aged 65 years and over accounting for 65.3% of the total cancers registered in 2016.
Age-standardised rates of cancer registrations per 100,000 people have increased in both males and females for the period 1995 to 2016; during this period, cancer incidence rates have increased from 648.8 to 663.4 per 100,000 males and from 469.6 to 541.1 per 100,000 females.
The average rate of cancer incidence in England was 593.2 per 100,000 people, but this varied across the country from 556.7 per 100,000 people in London to 630.3 per 100,000 people in the North East.
2. Collaboration
This publication is produced in partnership with Public Health England (PHE). The cancer registration data in this bulletin has been collected by the National Cancer Registration and Analysis Service (NCRAS) in Public Health England.
3. Things you need to know about this release
Cancer registrations in England can take up to five years after the end of a given calendar year to reach 100% completeness, due to the continuing accrual of late registrations. Therefore, published figures for 2016 are likely to increase in future publications when late registrations are included. Refreshed data for 2012 to 2015 are shown in our time series (covering 1995 to 2016) in the datasets (Tables 10 and 11). Section 10 contains further details on how the data is processed and refreshed.
It is important to note the following with regards to the cancer registrations included in this analysis:
only malignant neoplasms (cancers as described by the World Health Organisation (WHO) ICD-10 codes C00 to C97) have been included in this bulletin, however, the datasets contain certain in-situ neoplasms, benign neoplasms and neoplasms of uncertain or unknown behaviour for completeness
incident cases of cancer are counted for each separate primary tumour; one person may be diagnosed with more than one tumour and would then appear twice in the incidence statistics; secondary tumours and recurrences of a previous cancer are not counted as new incident cases
unless stated otherwise, analysis in this bulletin excludes cancer registrations of non-melanoma skin cancer (NMSC); this is common practice in cancer analysis due to the unreliability in estimates caused by variation in policies and practices for the recording of NMSC (see Section 10 for more detail)
the published 2016 data have been estimated as 98.4% complete and there are likely to be late registrations provided after this publication (see Section 10 for more detail); due to refreshes to the historic data and differences in the level of completeness, care should be taken when making comparisons between the historic and latest available data; the published figures for 2016 are likely to increase in future publications (when late registrations are included)
4. Breast, prostate, lung and colorectal cancers continue to be the most common
In England, 303,135 new cancer diagnoses (excluding diagnoses for non-melanoma skin cancers) were registered in 2016, with more cancers being registered in males (155,019) than females (148,116).
The majority (93.1%) of cancer registrations were registered in 24 sites of the body. Just over half (52.7%) of all registrations were either breast, prostate, lung or colorectal cancer (Figure 1). These cancer sites are also the most common across the UK and worldwide.
Breast cancer was the most common cancer diagnosed in 2016, with 45,960 cases registered; 45,656 of which were registered to females, accounting for nearly one in three (30.8%) of all malignant female cancer registrations. Breast cancer has been the most frequently diagnosed cancer in England since 1996 when the number of new diagnoses first exceeded those for lung cancer.
Prostate cancer was the most common cancer diagnosed in males in 2016 with 40,489 cases registered, which accounted for one in four (26.1%) male malignant cancer registrations.
The second most common malignant cancer for both males and females was lung cancer. In 2016, there were 38,381 (20,560 males and 17,821 females) cases of lung cancer registered in England. Lung cancer accounted for 13.3% of total cancer registrations for males and 12.0% for females.
Colorectal cancer was the third most common malignant cancer for males and females. In 2016, there were 34,952 cases, with 19,581 males and 15,371 females being diagnosed with colorectal cancer.
Figure 1: The number of cancer registrations by the 24 major sites, England, 2016
Source: National Cancer Registration and Analysis Service within Public Health England; Office for National Statistics
Notes:
- The International Classification of Diseases Tenth Revision (ICD-10) was used to classify cancer sites. Non-melanoma skin cancers (ICD-10 C44) were excluded.
- All ages combined.
Download this chart Figure 1: The number of cancer registrations by the 24 major sites, England, 2016
Image .csv .xls5. Cancer incidence over the last decade
Generally, cancer incidence rates have increased over time. Over the last decade, the age-standardised cancer incidence rate for women has increased from 516.2 per 100,000 females in 2006 to 541.1 in 2016. For men, cancer incidence increased from 671.0 per 100,000 males in 2006 to a peak of 704.4 per 100,000 in 2013. Since 2013, a reduction in the prostate cancer incidence (from 192.1 per 100,000 in 2013 to 173.7 in 2016) has contributed to the overall cancer incidence for men falling to 663.4 per 100,000 males (in 2016) (Figure 2).
Figure 2: Directly age-standardised incidence rates per 100,000 people of newly diagnosed cases of cancer: England, 2006 to 2016
Source: National Cancer Registration and Analysis Service within Public Health England; Office for National Statistics
Notes:
- The International Classification of Diseases Tenth Revision (ICD-10) was used to classify cancer sites for incidence data for all years.
- Excluding non-melanoma skin cancer (ICD-10 C44).
- All ages combined.
Download this chart Figure 2: Directly age-standardised incidence rates per 100,000 people of newly diagnosed cases of cancer: England, 2006 to 2016
Image .csv .xlsFocusing on the most common cancers, the age-standardised incidence rate for breast cancer has increased from 162.3 per 100,000 females in 2006 to 167.9 cases per 100,000 in 2016.
Overall, prostate cancer incidence has increased over the last decade (from 172.9 per 100,000 males in 2006 to 173.7 per 100,000 in 2016). However, incidence rates reached a peak of 192.1 in 2013 before decreasing each successive year. This may be as a result of an increase in the uptake of Prostate-Specific Antigen (PSA) testing.
Colorectal cancer has decreased in both males and females. The age-standardised rate for colorectal cancer was 84.4 cases per 100,000 males and 55.4 cases per 100,000 females in 2016, compared with 89.5 cases per 100,000 males and 57.1 cases per 100,000 females in 2006.
The gap between lung cancer incidence in males and females continues to narrow. The age-standardised rate (for lung cancer) has decreased in males from 101.5 per 100,000 males in 2006 to 89.8 cases per 100,000 in 2016; whilst lung cancer in females has increased in this same period, from 57.9 cases per 100,000 females in 2006 to 65.5 per 100,000 in 2016. This change in incidence could be explained by the changes in smoking habits over the last decade or so, as smoking is identified as the most common cause of lung cancer (PDF, 286KB).
Mesothelioma is a form of cancer that takes many years to develop following the inhalation of asbestos fibres. In 2016, the age-standardised incidence rate for mesothelioma in males decreased to its lowest since 2002 at 8.3 per 100,000 males (Figure 3). The decrease in registrations could be as a result of the population who received occupational asbestos exposures (between 1950 and 1980) diminishing.
Figure 3: Directly age-standardised incidence rates per 100,000 people of newly diagnosed cases of mesothelioma: England, 1995 to 2016
Source: National Cancer Registration and Analysis Service within Public Health England; Office for National Statistics
Notes:
- The International Classification of Diseases Tenth Revision (ICD-10) was used to classify cancer sites for incidence data for all years.
- All ages combined.
Download this chart Figure 3: Directly age-standardised incidence rates per 100,000 people of newly diagnosed cases of mesothelioma: England, 1995 to 2016
Image .csv .xls6. Cancer diagnoses increase with age
Cancer registrations vary with age, with children and young adults (aged 0 to 24 years) accounting for 1.1% of all cancer registrations compared with those aged 65 years and over who account for 65.3% of all registrations.
As observed in Figure 4, incidence rates increase from ages 5 to 89 years with the latter age group (85 to 89 years) having the highest incidence rate for both males and females (3,365.3 and 2,141.1 registrations per 100,000 respectively).
Differences between sexes across age groups were also observed and showed rates of incidence were higher in females aged 15 to 59 years compared with males.
This was most marked in females aged 40 to 44 years whose rate was more than double that of males. This difference could be explained by the high incidence of breast cancer particularly among females aged 30 to 59 years, which accounted for 44.7% of all cancers among females of this age group.
Rates of cancer were higher for males aged 60 years and over; this could be explained by the incidence of prostate cancer, which accounted for 31.7% of cancers in males aged 65 to 79 years.
Figure 4: Number of cancer registrations and age-specific cancer incidence rates (per 100,000) in England, 2016

Source: National Cancer Registration and Analysis Service within Public Health England; Office for National Statistics
Notes:
- Excluding non-melanoma skin cancer (ICD-10 C44).
Download this image Figure 4: Number of cancer registrations and age-specific cancer incidence rates (per 100,000) in England, 2016
.png (27.0 kB) .xls (33.3 kB)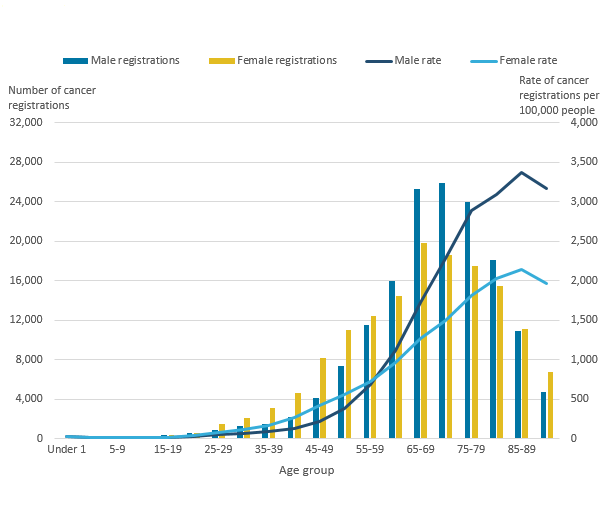
The World Health Organisation (WHO) explains that ageing is a “fundamental factor for the development of cancer. The incidence of cancer rises dramatically with age, most likely due to a build up of risks for specific cancers that increase with age.”
However, it is interesting to note that the most common cancers in England vary by sex and age group. For instance:
for males and females aged 0 to 14 years, the most common cancer registrations continue to be leukaemia, brain cancer, non-Hodgkin’s lymphoma (males) and kidney cancer (females), accounting for over half of the 1,444 registrations in children in 2016
for males aged 15 to 49 years, skin melanoma, testicular and colorectal cancer were the most common cancers registered, whereas for females the most common cancers were breast, skin melanoma and cervical cancer
for males and females aged 50 years and over, prostate, breast, lung and colorectal cancer were the most common cancers registered in 2016, as seen in 2015 also
It should be mentioned that the most common cancers vary by the age group used to categorise the data. The age groups we use were chosen to align with the age breakdown in our Cancer survival bulletins, which are designed to align with the NHS Outcomes Framework Indicators.
Back to table of contents7. Cancer incidence continues to be highest in the north of England and lowest in London
The rate of cancer incidence varies across the English regions. In 2016, the age-standardised rates ranged from 556.7 (London) to 630.3 (North East) per 100,000 people and the average in England was 593.2 per 100,000 (as shown in Figure 5).
Figure 5: Age-standardised incidence rate by English regions, all cancers, all persons, 2016
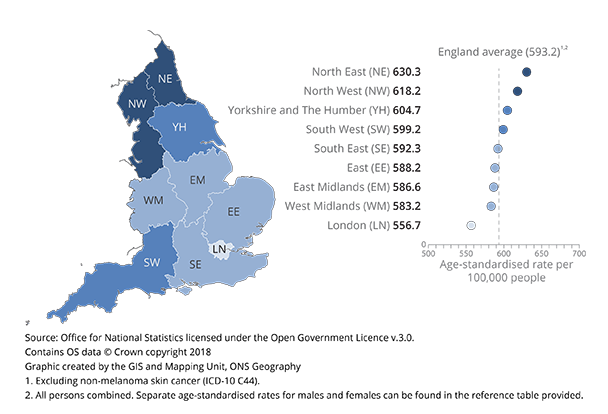
Source: Office for National Statistics licensed under the Open Government Licence v.3.0. Contains OS data © Crown copyright 2018 Graphic created by the GIS and Mapping Unit, ONS Geography
Notes:
- Excluding non-melanoma skin cancer (ICD-10 C44).
- All persons combined. Separate age-standardised rates for males and females can be found in the dataset provided.
Download this image Figure 5: Age-standardised incidence rate by English regions, all cancers, all persons, 2016
.png (109.3 kB) .xls (25.6 kB)
In 2016, the cancer incidence rate was 13.2% higher in the North East compared with London, which is a decrease in regional variation compared with the 14.7% difference in 2015.
The difference between incidence rates across England and in the North East has decreased since 2015, which highlights that the incidence rate in the North East is more like the national average. However, the difference between the incidence rate in London and the national average has increased.
Yorkshire and The Humber, and the South West were the only regions with an increase in incidence rates since 2015.
Regional variation for specific cancer sites
There are substantial variations in cancer incidence across the regions with specific cancer incidence rates not always being highest in the North East and lowest in London, for example:
the incidence rate for male bladder cancer varied from 24.8 per 100,000 in the North East to 29.4 in the North West
the incidence rate for breast cancer (females) varied from 157.7 per 100,000 in the North East to 179.7 in the South West
the rate of prostate cancer incidence was generally highest in the south of England and lowest in the north of England; varying from 147.9 per 100,000 in the North East to 192.5 in the South East
the incidence rate for female non-Hodgkin’s lymphoma varied from 18.0 per 100,000 in the West Midlands to 22.4 per 100,000 in the South West
Further details for the variation in cancer incidence rates for specific cancer sites can be found in the datasets (Table 6 of the datasets).
Colorectal and lung cancer
Colorectal and lung cancer are two of the most common cancers registered, however, the incidence rates, for each sex, varied substantially across the country. The regional distribution for lung cancer was very similar for males and females, whereas the regional variation in colorectal cancer differed substantially between sexes. Although bowel cancer screening is available to anyone over 55 years old, the services offered and the patient uptake may vary across the country.
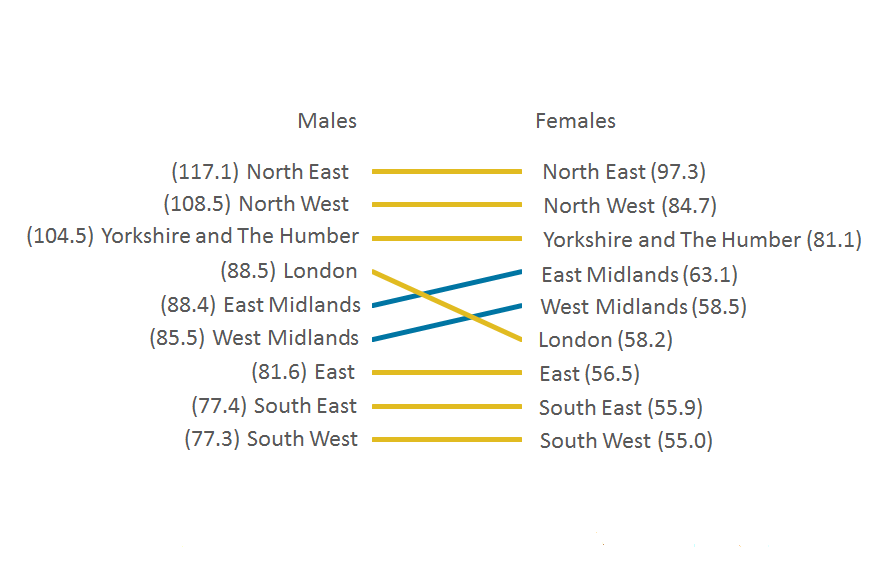
Incidence rates for male colorectal cancer were highest in the north and lowest towards the south, the East of England and London. For females, incidence rates were highest in the East of England and the south, and lowest in the East Midlands and London (Figure 6).
For lung cancer, both male and female incidence rates were highest in the north and lowest in the south, with few differences between sexes (Figure 7).
Figure 6: Age-standardised cancer incidence rates (per 100,000 people) of colorectal cancer ranked by English regions, males and females, 2016
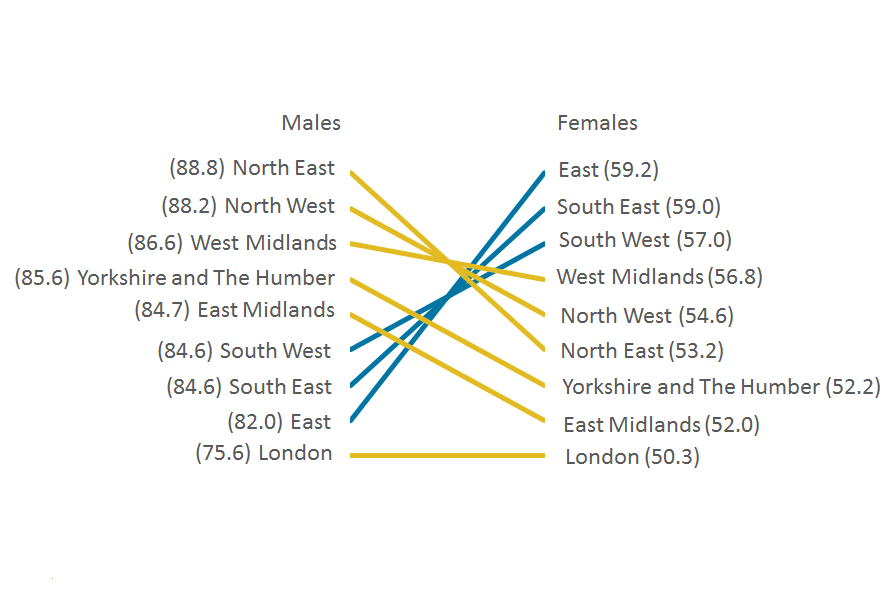
Source: National Cancer Registration and Analysis Service within Public Health England; Office for National Statistics
Notes:
- Colorectal cancer is defined according to the International Classification of Diseases, Tenth Revision (ICD-10) as malignant neoplasm of colon and rectum C18-C20.
- Incidence rates are ranked by region for the chart. Lighter (yellow) lines are used when the region is ranked higher for males than females, or equal. Darker (blue) lines are used when the region is ranked higher for females than males.
Download this image Figure 6: Age-standardised cancer incidence rates (per 100,000 people) of colorectal cancer ranked by English regions, males and females, 2016
.png (47.0 kB) .xls (28.2 kB)
Figure 7: Age-standardised cancer incidence rates (per 100,000 people) of lung cancer ranked by English regions, males and females, 2016
Source: National Cancer Registration and Analysis Service within Public Health England; Office for National Statistics
Notes:
- Lung cancer is defined according to the International Classification of Diseases, Tenth Revision (ICD-10) as malignant neoplasm of trachea, bronchus and lung C33-C34.
- Incidence rates are ranked by region for the chart. Lighter (yellow) lines are used when the region is ranked higher for males than females, or equal. Darker (blue) lines are used when the region is ranked higher for females than males.
Download this image Figure 7: Age-standardised cancer incidence rates (per 100,000 people) of lung cancer ranked by English regions, males and females, 2016
.png (31.7 kB) .xls (28.2 kB)
It is important to note that caution should be taken when interpreting regional variations. There are regional differences in lifestyle behaviours (PDF, 286KB), such as the variance in drinking habits and smoking prevalence across the country. Furthermore, factors should be considered like Prostate-Specific Antigen (PSA) testing, which is not a national screening programme. Any regional differences in the availability and uptake of this test may contribute to regional differences in the age-standardised rate.
Back to table of contents8. Fewer people are dying from cancer in England
Despite the increasing trend in cancer incidence over time, cancer mortality rates continue to decrease. Cancer (defined as ICD-10 C00-D48) accounted for 28.5% of all deaths registered in England in 2016 and remained the most common broad cause of death for both males and females (30.9% and 26.2% respectively) as published in the Deaths Registered in England and Wales release.
The age-standardised mortality rate from cancer decreased between 2006 and 2016, from 366.7 to 323.7 per 100,000 males and from 244.3 to 226.7 per 100,000 females. Figure 8 focuses on the incidence and mortality trends of the most common cancers in males and females.
The age-standardised mortality rate for prostate cancer decreased from 52.7 per 100,000 males in 2006 to 47.5 per 100,000 males in 2016, whilst breast cancer decreased from 41.5 to 34.1 per 100,000 females (Table 1).
This decreasing mortality contrasts to the increase in incidence, indicating that the number of patients surviving breast and prostate cancer has improved. With advances in medicine and technology, early detection of cancers has improved resulting in a reduction in the number of people dying from the disease.
Table 1: Age-standardised cancer mortality and incidence rates for female breast cancer (ICD-10 C50) and prostate cancer (ICD-10 C61) in males, England, for selected years 2006, 2011, 2015 and 2016
| Unit | Rate per 100,000 people | |||
|---|---|---|---|---|
| 2006 | 2011 | 2015 | 2016 | |
| Breast cancer mortality | 41.5 | 37.0 | 34.3 | 34.1 |
| Prostate cancer mortality | 52.7 | 50.2 | 49.5 | 47.5 |
| Breast cancer incidence | 162.3 | 164.1 | 170.5 | 167.9 |
| Prostate cancer incidence | 172.9 | 177.3 | 179.4 | 173.7 |
| Source: National Cancer Registration and Analysis Service within Public Health England; Office for National Statistics | ||||
Download this table Table 1: Age-standardised cancer mortality and incidence rates for female breast cancer (ICD-10 C50) and prostate cancer (ICD-10 C61) in males, England, for selected years 2006, 2011, 2015 and 2016
.xls (35.8 kB)
Figure 8: Directly age-standardised rates per 100,000 people of newly diagnosed cases of breast and prostate cancer and deaths from breast and prostate cancer, England, 2006 to 2016
Source: National Cancer Registration and Analysis Service within Public Health England; Office for National Statistics
Notes:
- The International Classification of Diseases Tenth Revision (ICD-10) was used to classify cancer sites for incidence data for all years.
- All ages combined.
- The increase in incidence over time is partly due to prostate-specific antigen (PSA) testing which began in the early 1990s.
Download this chart Figure 8: Directly age-standardised rates per 100,000 people of newly diagnosed cases of breast and prostate cancer and deaths from breast and prostate cancer, England, 2006 to 2016
Image .csv .xlsIt is important to note that the data presented in Figure 8 are from different cohorts of patients and so direct comparisons should not be made. For example, a patient who died from cancer in 2016 may well have been diagnosed prior to 2016 and so will not be included in the 2016 cancer incidence figures.
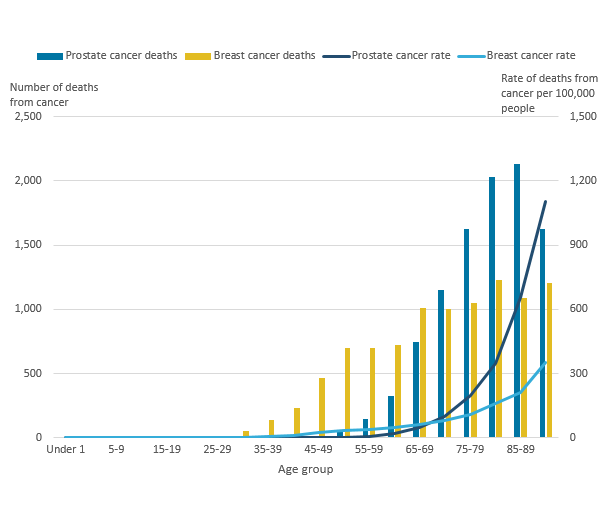
Deaths from cancer increase with age
Deaths from cancer increase with age; the largest difference in the mortality rate was for adults aged 90 years and over, where the cancer mortality rate was 1,923.0 cases per 100,000 for females compared with 3,750.1 cases per 100,000 for males.
Figure 9 shows the mortality rates of breast and prostate cancer increase with age of diagnosis. At age 50 to 54 years, the respective mortality rates were 35.6 per 100,000 females compared with 2.5 per 100,000 males. While at age 90 years and over, the prostate cancer mortality rate was 1,103.9 per 100,000 males compared with 353.3 per 100,000 females for breast cancer.
Figure 9: Number of deaths from cancer and age-specific rates of deaths from cancer (per 100,000) in England, 2016
Source: National Cancer Registration and Analysis Service within Public Health England; Office for National Statistics
Notes:
- This data is based on mortality data available on NOMIS.
- Breast cancer in females and prostate cancer in males.
Download this image Figure 9: Number of deaths from cancer and age-specific rates of deaths from cancer (per 100,000) in England, 2016
.png (19.8 kB) .xls (25.1 kB)
9. Reported measures
Cancer incidence rate
The number of new cancer registrations in a specific population during a particular time period per 100,000 people. This is calculated using the following equation:
Cancer incidence rate equals (total number of cancer registrations divided by total population) multiplied by 100,000
A cancer incidence rate can be calculated by specific age groups; this is referred to as an age-specific cancer incidence rate. We calculate incidence rates for ICD-10 codes C00 to C97 and D00 to D48 (excluding D04, D10 to D31, D34 to D35.1, and D35.5 to D36), all of which can be found in the associated datasets.
Age-standardised cancer incidence rate
A weighted average of the age-specific cancer incidence rates, the weights used are age-specific proportions of a standardised population European Standard Population 2013 (ESP 2013). By standardising cancer incidence rates with the ESP, geographical and time comparisons can be made, as the differing age structure of a particular population has been accounted for.
Mortality to incidence ratios
Cancer mortality to incidence ratios are calculated by dividing the number of deaths from cancer by the number of cancer diagnoses for each given cancer site, sex and region. It is important to note that the number of deaths from cancer might include people who were diagnosed before 2016; therefore, caution should be taken when interpreting these statistics.
Standardised registration ratio (SRR)
A cancer incidence rate (age- and sex-specific) is taken as a standard rate; we take England as the standard. The standard rate is then applied to another index population of known age structure (for example, the South West of England) to calculate how many registrations would have been expected in this index population had they, at each age group, experienced the standard cancer incidence rate (in this example, England).
The “expected” incidence is then compared with the observed incidence rate in the index population (in this example, the South West), with the ratio being multiplied by 100 to give the standardised registration ratio, in which 100 is the value for the standard rate (in this example, England). An SRR of 106 would mean the cancer incidence in the index region (in this example, the South West) is 6% higher than the standard rate (England). Conversely, an SRR of 94 would mean the cancer incidence was 6% lower.
Back to table of contents10. Cancer registration data
Data collection
Cancer registration is the systematic collection of data about cancer and tumour diseases. In England, this data collection is managed by National Cancer Registration and Analysis Service (NCRAS) in Public Health England. Every year, NCRAS collects information on over 300,000 cases of cancer, including patient details, as well as detailed data about the type of cancer, how advanced it is and the treatment the patient receives.
Data are submitted to NCRAS from a range of health care providers and other services (for example, histopathology and haematology services, radiotherapy departments, screening services, general practitioners and so on). By obtaining data from multiple sources and then matching and merging them as required, NCRAS can build a complete picture of the incidence of cancer in England, as well as understanding how cancer patients are diagnosed, treated and their outcomes. As the data come from different sources, the data is validated and processed to ensure the quality and accuracy of the data is consistent and to a high standard.
NCRAS collate and validate all the data for each patient including carrying out quality assurance checks, which have, from registration year 2016, completely transferred from Office for National Statistics (ONS). Once all the expected records for any one incidence year have been received and validated, NCRAS take a snapshot of the dataset, which provides a single, consistent source of cancer registrations.
Cancer incidence tables for this release were created from a snapshot taken in December 2017. It is important to understand that the snapshot of cancer registration data will vary year-on-year due to the dynamic nature of the registration data. Therefore, you will find that the incidence count for 2015 (for example) higher in the current publication compared with the previous publication.
The collected cancer data are dynamic in a number of ways, such as:
new cancer cases will be registered; this can include new “late” registrations, where a case is registered after ONS has published for a particular year
cancer records can be amended: for example, the site code of a record would be modified if later, more accurate information became available
cancer records can be cancelled, although this is unusual
We receive a subset of registration data from NCRAS, which once we have carried out a series of final validation and quality assurance checks, enables us to publish the numbers and rates of all types of cancer by age, sex and region of residence in this National Statistic release.
The final checks run by ONS include the compatibility of the cancer site and the associated histology and are closely based on those promoted by the International Agency for Research on Cancer.
Taking a new snapshot of the dynamic NCRAS database usually results in a difference between what was previously published and what is published from this latest snapshot dataset. The balance between ensuring completeness of the data but publishing cancer incidence figures in a timely manner is a necessary compromise.
For this release, we have published refreshed data back to the start of 2012, where previously we have included updated records from 1995 onwards. As we would expect, there are fewer changes or additional diagnoses added each year, due to late registration, the further back you go. Given the small number of changes taking place after five years, we have focused on updating from 2012 onwards. It is our intention to carry out an annual refresh of the last 10 years and we expect to make a fuller refresh in future, starting with next year’s publication.
The gap between the diagnosis counts that were first published for a registration year and the most recent cancer incidence figures has varied considerably over time, as shown in Figure 10. Over the 44-year period reported, differences between what has previously been published and the current number of registrations (refreshed in 2018) for each year average less than 5%.
Figure 10: Number of neoplasm registrations previously published in the annual report and currently on the ONS National Cancer Registry database, England, 1971 to 2015
Source: National Cancer Registration and Analysis Service within Public Health England; Office for National Statistics
Notes:
- Figures for 1971 to 1994 have been extracted from the “frozen” historical data-set.
- The published figures for 1971 to 1978 correspond to all malignancies, not all registrations. From 1979 the numbers refer to all malignant and benign cancer registrations including non-melanoma skin cancer (C44).
- Successful work has been completed to code a backlog of cases for non-melanoma skin cancer (C44) since 2013, which will show an increase in the published data in 2014.
- Figures for 2012 to 2015 were refreshed by January 2018, whereas figures for 1995 to 2011 were refreshed by January 2017. Previously published figures are taken from the corresponding cancer registration report. For example, figures for 2014 were taken from the report published in May 2016.
Download this chart Figure 10: Number of neoplasm registrations previously published in the annual report and currently on the ONS National Cancer Registry database, England, 1971 to 2015
Image .csv .xlsData quality
The figures for numbers and rates of “all cancers” in this release refer to all malignant neoplasms (ICD-10 C00 to C97), excluding non-melanoma skin cancer (ICD-10 C44). Although non-melanoma skin cancer (NMSC) is very common, the available figures are known to be under-estimates and unreliable for comparison purposes. This is because the policies and practices for the recording of NMSC have varied among the cancer registries. Although the numbers of newly diagnosed cases of NMSC are reported within the accompanying datasets, NMSC registrations have been excluded from the figures for “all cancers” in this publication.
Known data quality matters this year:
any regional differences in benign, uncertain and unknown neoplasms should be interpreted with caution; there is known historic variation in the way cancer registries recorded these tumours across the country and they do not receive as much analytical attention and scrutiny as the invasive cancers
the last five years of cancer registrations are more likely to be subject to change as we refresh the dataset in future publications, as most changes will occur within the latest five years; any commentary based on these last few years is less reliable as we estimate (based on 2013 to 2015) it to be only 98.4% complete and commentaries relating to less than the last five years are meant as current observations of the data and should not be taken as long-term estimates on cancer trends
approximately 80% of cause of death coding is complete by the IRIS (version 2013) software package; it was identified that IRIS was incorrectly coding “squamous cell carcinoma”, following discussions with topic experts, it was agreed that “squamous cell carcinoma” should be coded to ICD-10 C44, which has resulted in an increase in deaths coded to C44 in 2016
Further details about the cancer registration data can be found in the Cancer Registration Statistics Quality and Methodology Information report and in previous annual publications.
Back to table of contents11. Policy context
Users of cancer registration statistics include government organisations, health policy-makers, cancer charities, academics and researchers, cancer registries, the general public and the media.
Cancer registration statistics are used to:
provide an evidence base to inform cancer policy and programmes, and allow policy-makers to measure the occurrence of cancer within the population in England; cancer incidence data are used alongside cancer prevalence, mortality and survival to determine the overall burden of cancer
inform cancer research
feed into cancer information leaflets, web pages and campaigns to raise cancer awareness
produce National Statistics on cancer survival (in conjunction with mortality data), which is used to support policy on prevention and treatment, and to monitor a number of performance indicators for the healthcare system; the indicators set for the NHS Outcomes Framework include 1-year and 5-year cancer survival for all cancers combined and separately for colorectal, breast and lung cancer
brief Parliamentary ministers and respond to Parliamentary questions
provide bespoke, aggregated tables in response to customer enquiries
Linked to the need for information on the stage of cancer diagnosis, the National Cancer Registration and Analysis Service (NCRAS) in Public Health England published the Cancer Outcomes: Stage at Diagnosis December 2017 release, which coincided with the first release of this bulletin (in January). That release contained the proportion of emergency presentations of cancer and the proportion of cancers diagnosed at early stage for 10 cancer sites combined, in each quarter for 2016. Early stage is defined as stage one or stage two cancer, as opposed to stage three, stage four, or unknown stage at diagnosis. The data are presented for each clinical commissioning group (CCG) and for England as a whole, which can also be found in PHE/NHS England CancerData Dashboard.
Back to table of contents13. Quality and methodology
The Cancer Registration Statistics Quality and Methodology Information report contains important information on:
the strengths and limitations of the data and how it compares with related data
uses and users of the data
how the output was created
the quality of the output including the accuracy of the data
The age-standardised rates in this release are expressed per 100,000 population and are standardised to the European Standard Population 2013 (ESP 2013). They are standardised to allow for more robust comparisons between males and females, years and geographical areas. Previously published rates for 1995 to 2011, based on ESP 1976, have been recalculated using the ESP 2013. Rates will therefore differ from those previously published. More information is available in The impact of using 2013 European Standard Population to calculate mortality and cancer incidence rates.
Cancer incidence rates are based on the latest mid-year population estimates for the reference year at the time of publication.
By most common, we mean the cancer sites with the greatest number of cases registered per year. Furthermore, we look at only cancers, which are coded in the International Statistical Classification of Diseases 10th Revision (PDF, 2.1MB) (ICD-10) as C00 to C97, excluding C44 (non-melanoma skin cancer) and therefore exclude non-malignant codes D00 to D48.
In common with cancer registries in other countries, cancer registrations in England can take up to five years after the end of a given calendar year to reach 100% completeness, due to the continuing accrual of late registrations. The figure of 98.4% is an estimate of completeness based on the figures published for three previous years’ data (2013 to 2015), compared with the number of late registrations subsequently received for these years in the refreshed time series, from 2012 to 2015, published in 2018. It is therefore the difference between what figures have been published in all ONS cancer incidence publications within a given reporting year, versus late registrations received after the publication date cut-off and updated in a subsequent year. It is not an estimate of the number of cancers that never get recorded.
The cancer registries follow agreed procedures when submitting data. These are summarised by three levels of quality status, where levels one and two can be included in tables. It is a requirement that when a registry’s data for a particular year are complete, no more than 0.5% of records should have a quality recorded as Status 3 and over the past 15 years the proportion of records with serious errors has consistently been 0.1% or less. The quality status of all the records on the ONS cancer registration database from 1971 to 2015 is shown in Table 14 of the datasets associated with this publication.
Bespoke tabulations of cancer data for England can be requested (subject to legal frameworks, disclosure control, resources and agreement of costs, where appropriate). Such enquiries should be made to the Cancer Analysis Team via email at cancer.newport@ons.gov.uk or by telephone at +44 (0)1633 651848.
For other data requests, we may have to refer enquires to the Office of Data Release (ODR) within Public Health England.
Details of the policy governing the release of new data are available from the UK Statistics Authority.
Back to table of contents14. Acknowledgements
This work uses data provided by patients and collected by the NHS as part of their care and support. All personal data is handled confidentially by Office for National Statistics (ONS) and Public Health England (PHE), in accordance with relevant legislation and codes of conduct.
Back to table of contents